

Last Updated: August 8, 2026
Activity 8: Plan Project Communication
With Microsoft Project Reports, project managers can easily summarize schedule performance, track milestones, monitor resource utilization, forecast workload, and show the overall project status. These reports can be shared with executives, team members, customers, and sponsors to help everyone make informed decisions. There are four reporting features in Microsoft Project:
Printable Views that best communicate schedule, resource, workload, timeline, and project performance information.
Standard or predefined reports.
Visual Reports that export data to Excel or Visio.
Screen Capture commands that use Copy Selection, Cop Picture, Copy Timeline, and Copy Report.
A project plan is only useful if the right people get the information they need. Team members need to know their tasks and priorities. Managers look for performance updates. Customers want to hear about deliverables and milestones. Executives rely on summary information to make decisions. If there is no organized way to share this information, even the best project plan can lose its value.
In Activity 7, you set up the schedule logic for your project. You arranged activities and milestones in order, checked timing constraints, and set up the Calculation Engine to figure out dates, float, and the critical path. This gave you a project plan that can provide useful schedule and performance details.
In this Activity, you will learn how to turn that information into clear project communication. You will find out what each stakeholder needs to know, set up a reporting schedule, define reporting standards, and look at the different reports, views, dashboards, and visual tools in Microsoft Project. You will also see how project managers use Status Dates, reporting schedules, and communication networks to help monitor the project and make decisions from start to finish.
By the end of this Activity, you will have a clear communication system that ensures the right people receive the right information when they need it.
New to the MS Project Master Class?
If you found this page through a search engine or external link, use the Start Here button below to learn about the Free and Complete MS Project Master Classes, the Learning Portal, Project MAP framework, Activity Workspaces, exercises, and the Master Project.
Figure 8.1 Plan Project Communications in Project MAP. This figure places Activity 8: Plan Project Communication within the Project MAP (Model, Activities & Phases) framework, illustrating how it follows Determine Schedule Logic and precedes Evaluate Risk. Use this roadmap to understand where project communication fits within the overall project management process and how effective reporting transforms schedule data into information that supports project monitoring, decision-making, and stakeholder engagement.
Activity 8 - Plan Project Communication
Activity 7: Determine Schedule < Activity 8: Plan Project Communication > Activity 9: Evaluate Risk
Workflow (45 minutes)
Exercises (3 hours 25 minutes) jump to
Exercise 8.1: Create the Communication Network and Reporting Cycle for Your Master Project (30 minutes) jump to
Exercise 8.2: Review Microsoft Project’s Eight Field Types (20 minutes) jump to
Exercise 8.3: Print Views as Reports (20 minutes) jump to
Exercise 8.4: Create and Edit Standard Reports (40 minutes) jump to
Exercise 8.5: Create Visual Reports (30 minutes) jump to
Exercise 8.6: Copy Picture, Timeline, or Report (30 minutes) jump to
Exercise 8.7: Create Reports for Your Master Project (20 minutes) jump to
Update Journal on Plan Project Communication (15 minutes) jump to

This entire Activity Workspace should take 4 hours and 35 minutes to complete.
This Activity Workspace is part of the MS Project Master Class learning system and the companion Master Class Book available on Amazon. Many students also complete the Master Class with the assistance of a Master Class Coach or Trainer.
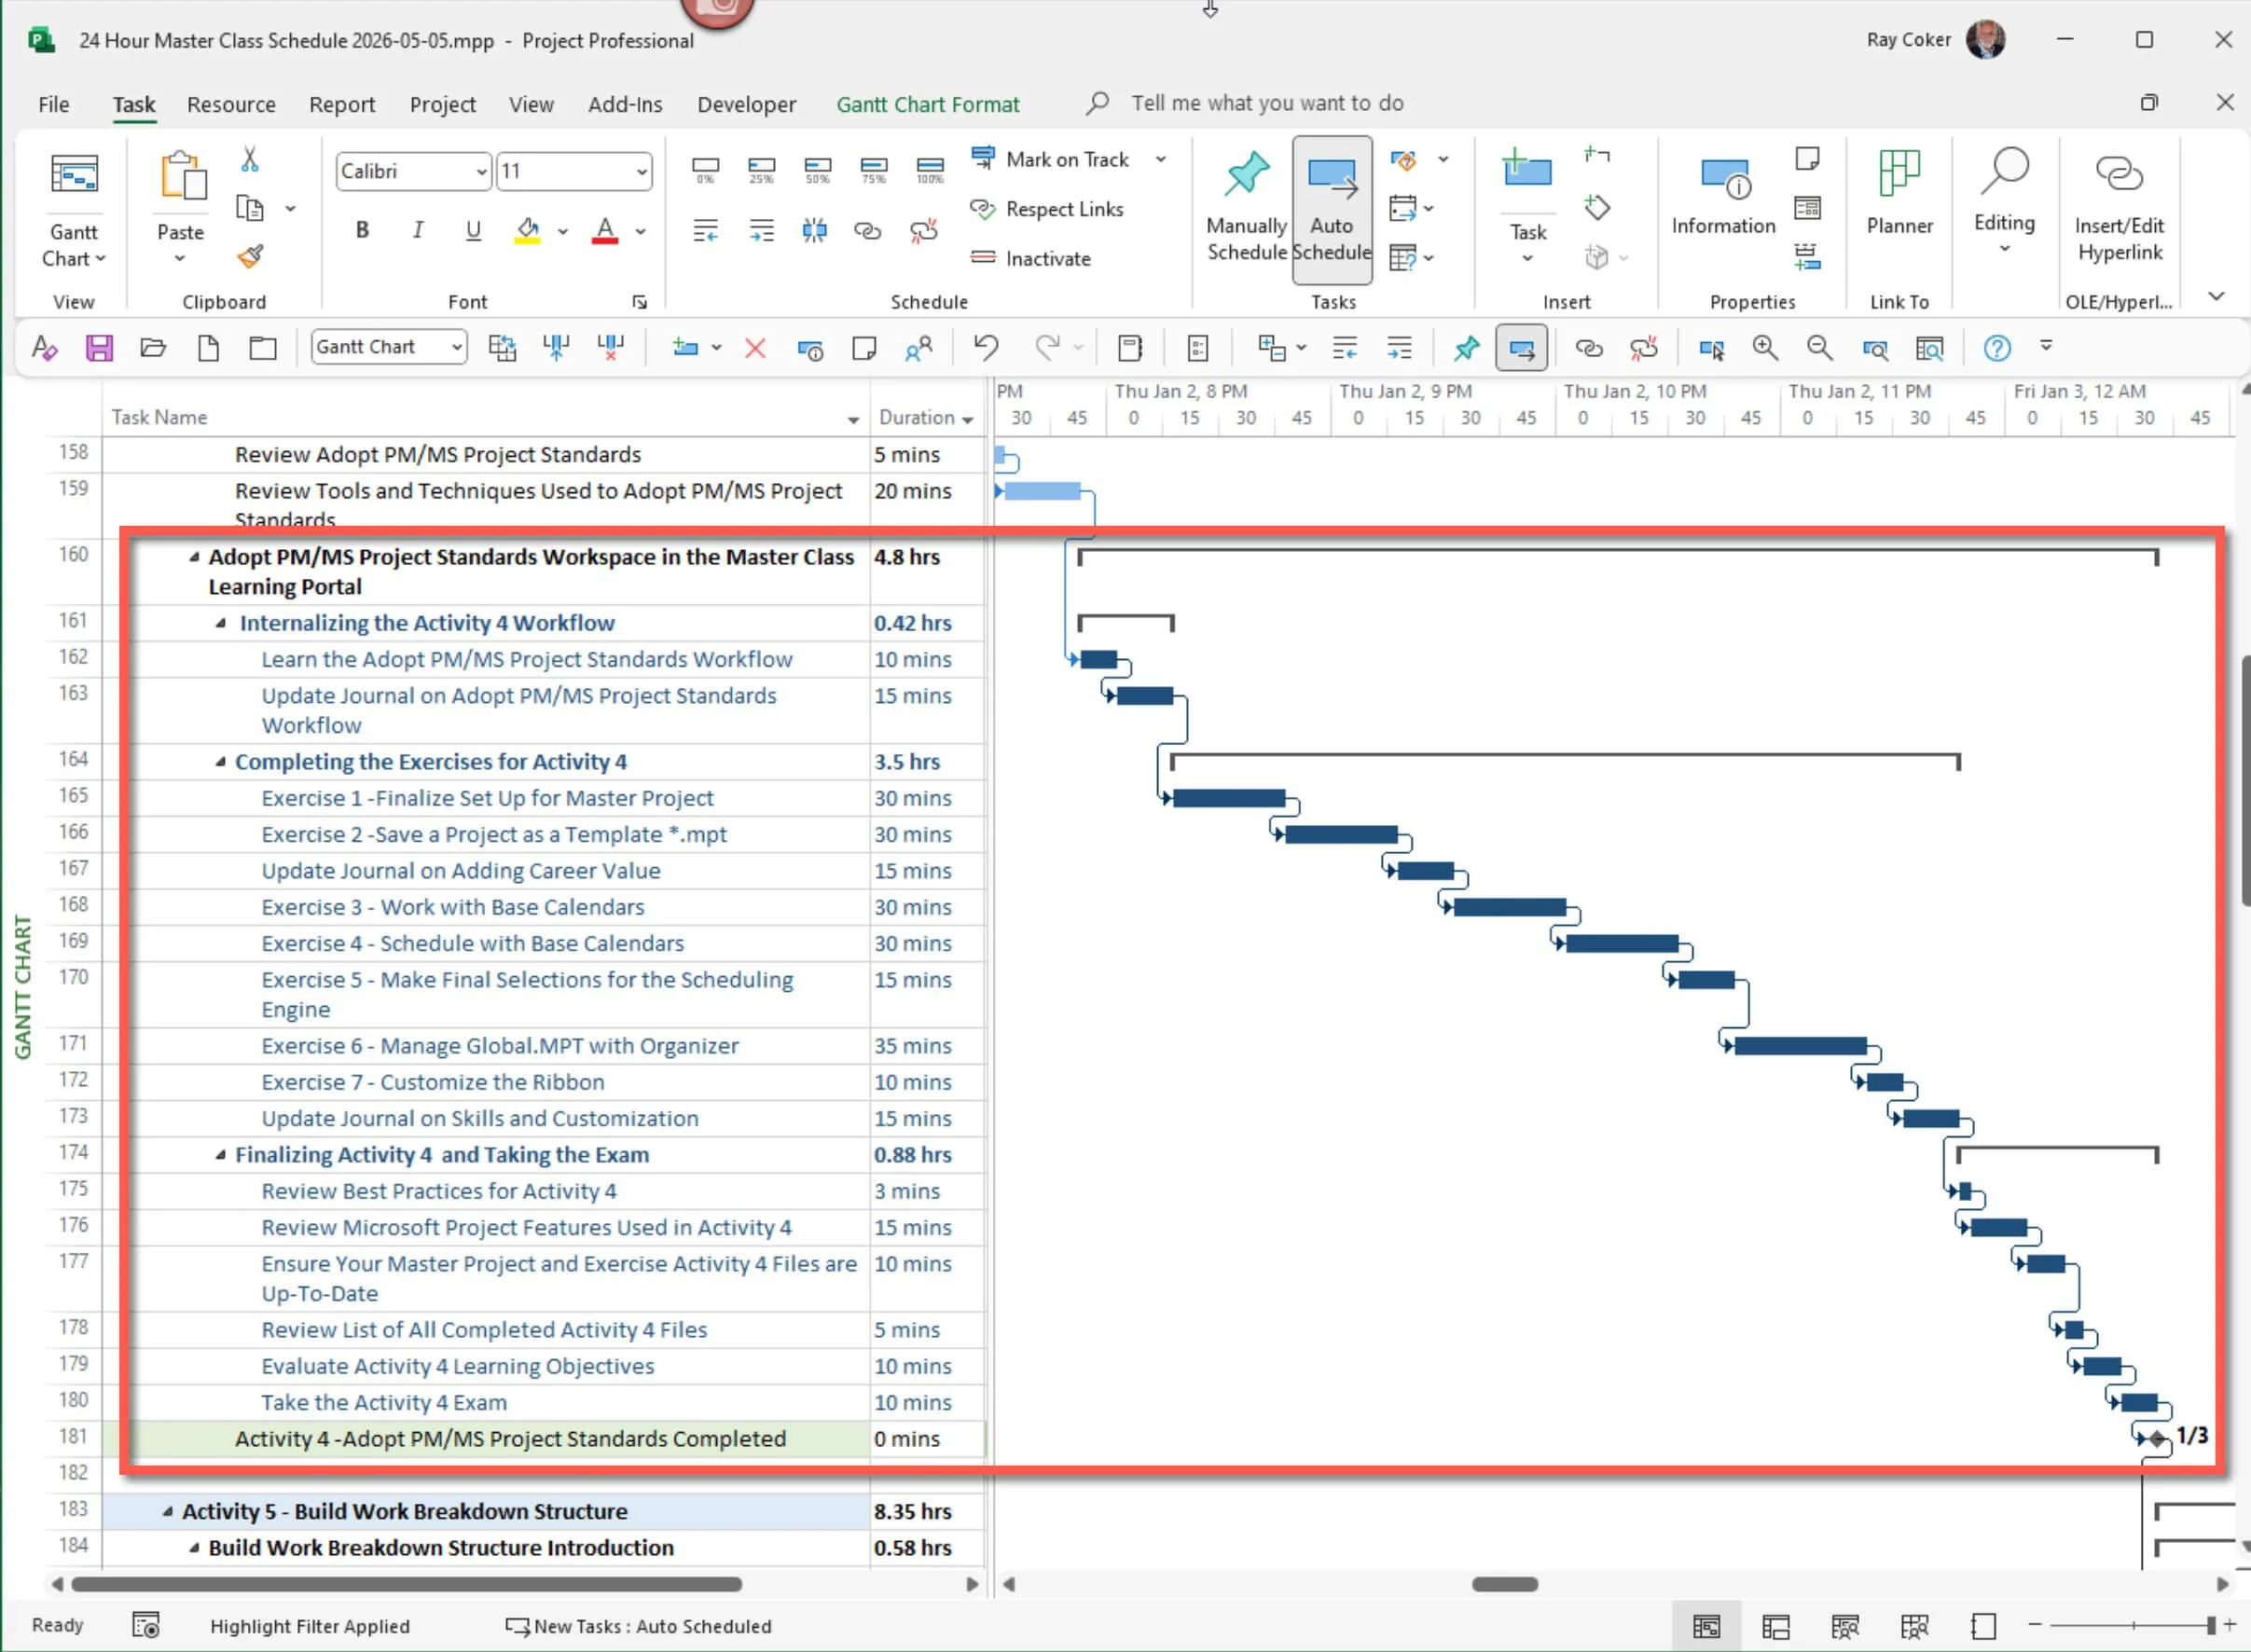
Figure 8.2 Workspace schedule. This figure displays the complete Activity 8 Workspace schedule in Microsoft Project, showing the workflow, exercises, journal, review activities, and estimated completion times organized in a Gantt Chart. Use this schedule to understand the sequence of learning activities and the time required to complete each step while following the Activity 8 learning path.
The communication and reporting methods and best practices shared in this Activity Workspace come from over 35 years of experience teaching Microsoft Project, training consultants, deploying Project Server, and helping professionals around the world.
Workflow
Internalizing the Activity 8 Workflow (25 minutes)
Overview and What You Will Learn
Project managers spend a lot of time sharing project information. Things like schedules, status updates, milestone reports, resource forecasts, dashboards, executive briefings, team assignments, and performance reports all rely on a clear communication system. Many projects run into problems because they never clearly define what reports are needed, how often to report, or what information stakeholders want.
In Activity 8, you will learn how to plan project communications and set up the reporting systems needed to manage and control a project. You will learn how to identify who needs to communicate, which reports are needed, how often to report, and how to create reports in Microsoft Project. You will also see how Microsoft Project organizes information and how to turn that data into reports, dashboards, and other tools for sharing project updates.
First, you will figure out who needs project information and what details they need. Then, you will decide how often to create and share reports. Finally, you will establish reporting standards and produce reports that show project status, performance, forecasts, assignments, and other key information for stakeholders.
Think of a ship's log as an example. For centuries, captains used logbooks to record weather, the ship’s position, course changes, maintenance, and important events. They recorded different information at different times for different people, such as navigators, owners, harbor officials, insurers, and future crews. Similarly, project managers need to decide what information to report, who needs it, how often to share it, and which tools to use.
By the end of this Activity, you will know how to turn project data into useful information that supports decision-making, keeps stakeholders involved, strengthens project oversight, and improves project management. This reporting foundation will be even more important as you continue with the next Activities and start managing your Master Project.
Learn Plan Project Communications Workflow (10 minutes)
Mapping the Fleet: Identify Communication Network
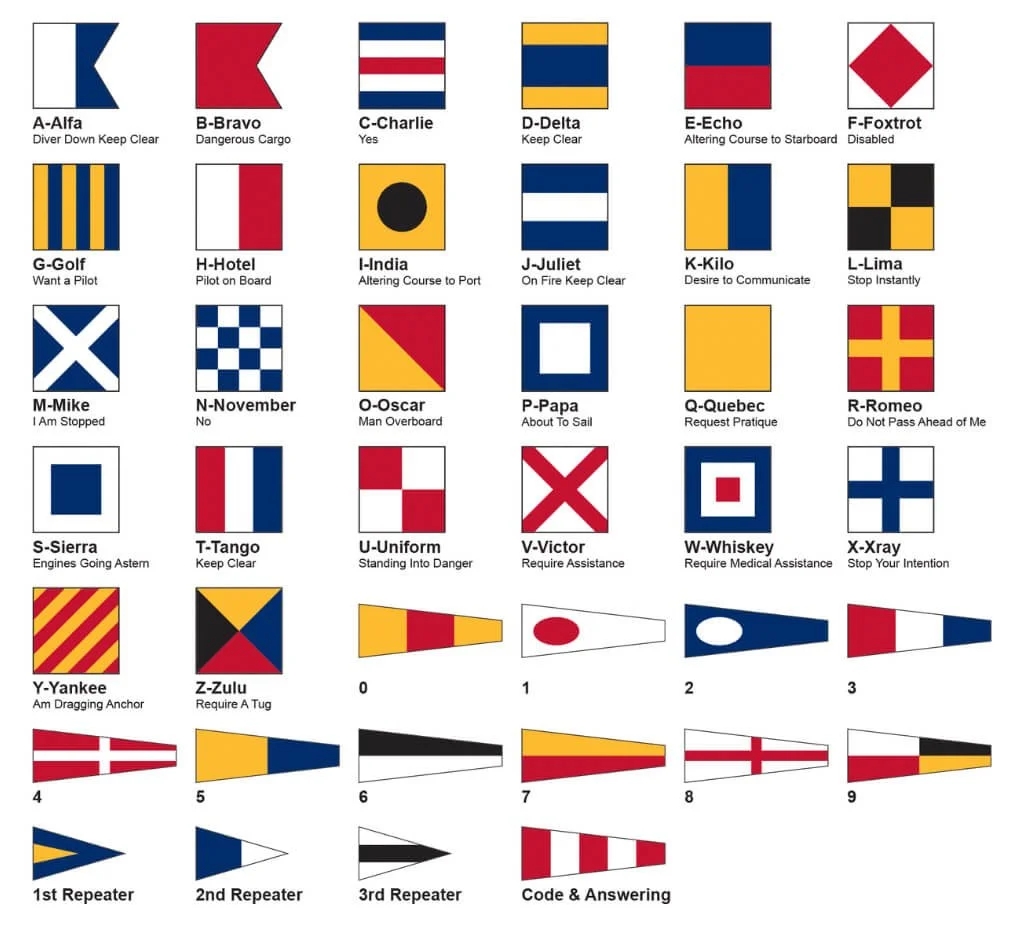
Before setting out on a major voyage, the captain needs to figure out who needs information about the trip. This group might include vessel owners, harbor authorities, customs officials, family, crew, maintenance teams, insurers, and marinas at the destination. Each person or group needs different details. Some want operational updates, while others just need a general status report.
This is similar to the step in project management where you identify the communication network. Before creating reports, the project manager needs to know who needs the information, what they need, and how it will support project oversight and decision-making.
Keeping the Ship's Log: Define Reporting Cycle
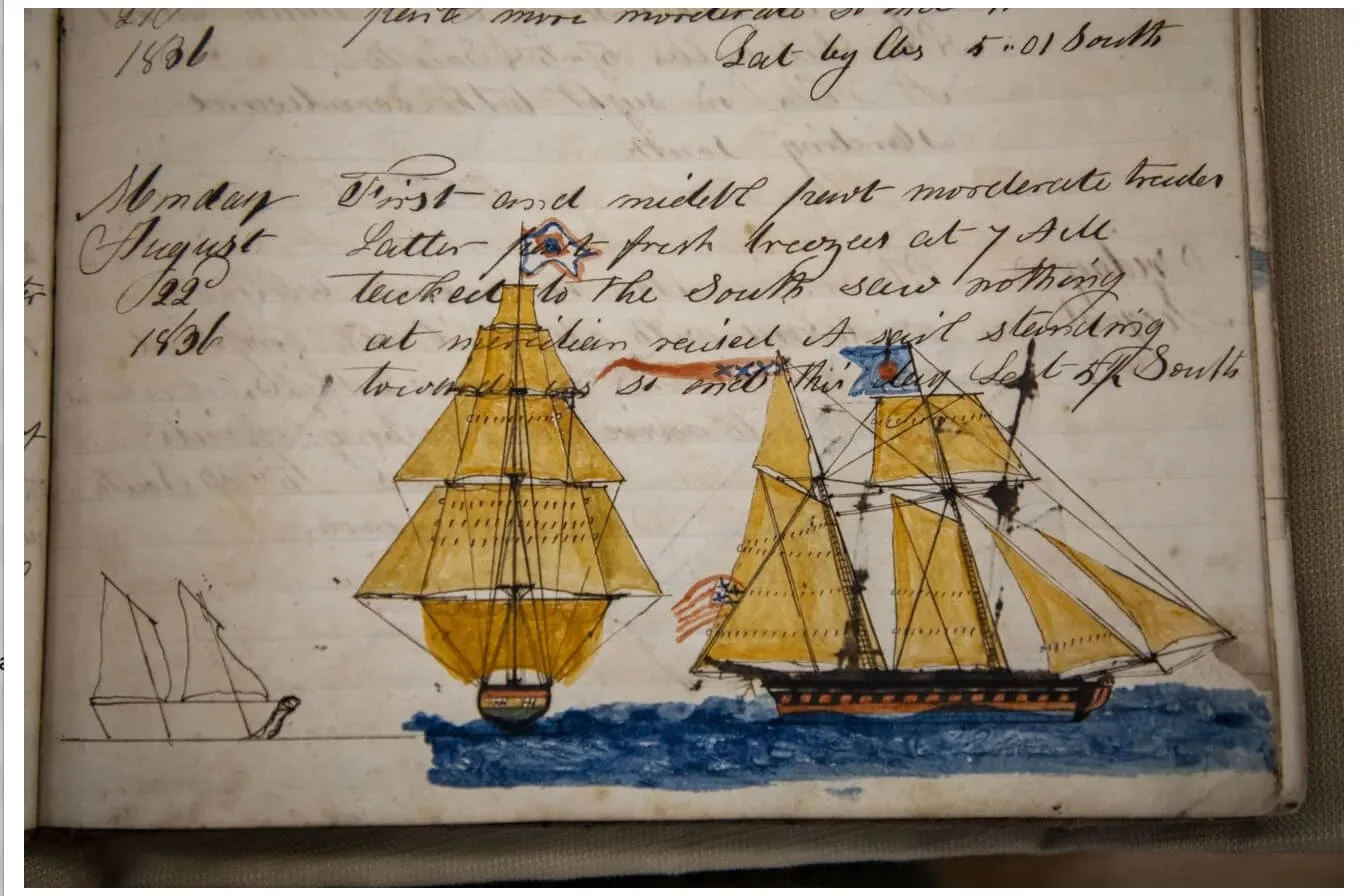
A good captain knows that information matters only when it is recorded and shared at the right moment. Since the Age of Sail, ships have used logbooks to keep track of important details about each journey. The term 'ship's log' comes from an old navigation method in which sailors measured speed using a wooden log tied to a rope with knots at set intervals. They wrote these results in a logbook, which later became the official record of the trip.
As time went on, the ship's log became more than just a way to track speed. Captains and officers used it to note weather, the ship’s position, changes in course, maintenance, crew tasks, important events, and decisions. This log gave everyone—from navigators and captains to owners, harbor officials, insurers, and future crews—a clear way to review what happened on board.
Different kinds of information were recorded at different times because they served different needs. Weather might be checked several times a day. Navigation logs could be updated every shift. Position reports might be sent daily. Maintenance records could be reviewed once a week. Each type of information had its own reporting schedule based on who needed it and why.
This parallels the workflow step of defining the reporting cycle, where the project manager decides what information to report, who needs it, when to create it, and how often to share it. Just as the ship’s log was the main record for a voyage, project reports, dashboards, and status updates are the main tools for tracking progress, informing decisions, and sharing updates during a project.
Building the Navigation Instruments: Define Reporting Standards and Reports

Captains use standard tools, charts, logs, and formats to keep track of and share how the voyage is going. Navigation charts show where the vessel is. Weather reports show changing conditions. Maintenance logs keep track of equipment status. Voyage summaries show progress toward the destination. Using the same reporting standards makes sure information is accurate, clear, and helpful for everyone who needs it.
This is like the project management step of setting up reporting standards and reports. In Microsoft Project, you can use Views, Tables, Groups, Filters, Reports, Dashboards, and Visual Reports to share project information clearly and consistently with different stakeholders throughout the project.
Throughout the journey, project managers must continually ask critical questions about the project's health and trajectory. Are we on track to meet objectives? How are tasks progressing? What deviations are occurring? These checks are essential for adjusting the course to ensure the project reaches its destination successfully.
Activity 8: Plan Project Communications provides a comprehensive framework and a navigational blueprint for planning and implementing communication strategies in project management. This approach ensures that all stakeholders are appropriately engaged and informed, guiding the project to successful completion as smoothly as navigating calm seas.

Activity 8: Plan Project Communications Workflow Chart
Before you begin the exercises in this Activity Workspace, take a moment to look over the Activity 8 Workflow Chart. Good project communication is intentional. You need to know who needs information, when to measure and share project progress, and which reports, views, dashboards, and standards will inform project decisions.
In this Activity, you will learn how project managers set up communication networks, plan reporting schedules, and create standards that turn project data into useful information. You will also see how Microsoft Project supports communication through views, reports, dashboards, visual reports, and other tools. Understanding this workflow first will help you complete the exercises and build a system that gets the right information to the right people when they need it.
Figure 8.3 Plan Project Communications Workflow. This figure presents the complete Activity 8 Workflow, beginning with identifying the communication network, defining the reporting cycle, establishing reporting standards, and selecting Microsoft Project reporting tools such as Views, Reports, Dashboards, Visual Reports, and Screen Capture commands. Use this workflow to internalize the logical sequence for planning project communications before completing the Activity exercises.

Download
Click the Download icon above and open the Plan Project Communications Workflow.pdf file.

Update Journal on Plan Project Communications Workflow - 20 minutes
Reflect on an experience where communication played a critical role in the outcome of a group project or activity.
Journal Question: “Based on what you've learned from this workflow on planning communications in project management, how would you approach communication differently if you were to manage a similar project today?”
Consider aspects such as identifying stakeholder needs, grouping stakeholders, prioritizing communications, and establishing reporting standards.
Exercises
Complete the Exercises for Activity 8 (3 hours, 55 minutes)
Microsoft Project provides a wide range of reporting options. These exercises involve creating your communication network, better understanding views and fields across eight categories, the four report areas, and then creating reports for your Master Project.
Create a Communication Network and a Reporting Cycle for your Master Project. A project comm
Review the eight field types in Microsoft Project. This is a complicated area, and it is important to understand these fields well. Indeed, understanding these fields will help you report better. One of the difficulties is that many fields have the same names across the eight field categories. For instance, Work. There are eight different work fields.
Print Views as Reports. Microsoft Project has seventeen types of views; eleven can be printed.
Create and Edit Standard Reports. We usually associate these traditional types of 9.5 X 11 reports with reporting.
Create Visual Reports. Visual Reports are typically data exported to Excel.
Copy Picture. There are several screen capture commands Copy Selection, Copy Picture, Copy Timeline, and Copy Report.

Definitions
Communication Network: A communication network for a project refers to the structured arrangement of pathways and methods through which information flows among the various stakeholders involved in the project. It encompasses all the channels, tools, and processes used to transmit information, ensuring that all parties are informed, engaged, and able to contribute effectively to the project's objectives. The design of a communication network considers factors such as the communication needs, preferences, and roles of different stakeholders, ensuring that information is shared in a timely, accurate, and accessible manner for all intended recipients. This network is critical for coordinating activities, making decisions, managing risks, and maintaining project alignment with its goals.
Reporting Cycle: A reporting cycle is a recurring process for collecting project updates, updating the project model, and allowing the Calculation Engine to recalculate schedule and performance information before communicating results to stakeholders.
Microsoft Project Dashboards: A dashboard provides a visual summary of key project details using charts, graphs, tables, and indicators. Instead of reading through many pages of schedules, stakeholders can quickly check the project's health and spot areas that need attention.
Microsoft Project offers built-in dashboard reports to help project managers track and share project performance. Dashboard Reports are found on the Report tab.
Project Overview dashboards give a broad summary of the project. They usually show progress, upcoming milestones, task status, and overall schedule performance. Project managers often use these reports to update sponsors and executives.
Resource Overview dashboards highlight the people and resources working on the project. They help spot how resources are used, if anyone is overloaded, how work is divided, and what staffing needs are coming up. These dashboards are especially helpful for project and functional managers who assign team members.
Cost Overview dashboards show a summary of the project's financial details. They display planned, actual, and remaining costs, as well as cost trends. These dashboards help stakeholders check financial performance and spot budget issues early.
Burndown Reports are often used in Agile and iterative projects. A burndown dashboard compares the work left to do with the time remaining, showing if the team is working fast enough to meet goals. Burndown charts give a quick view of schedule progress and team productivity.
Dashboard reports are useful because they distill large volumes of project data into information stakeholders can understand quickly. They help with project monitoring, communication, decision-making, and control without requiring detailed schedules or complex reports.
When planning project communications, project managers should decide which dashboards to use, who will get them, how often to send them, and what project decisions they will support.
Printing Views: In Microsoft Project, "printing views" refers to the ability to output various graphical or tabular views of project data to paper or as a digital document, such as PDF. These views show different aspects of the project, including schedules, resource allocations, Gantt charts, calendars, and task lists. Printing views facilitates communication and documentation, allowing project managers and team members to share information in meetings, presentations, or through physical or electronic files.
Microsoft Project supports several types of views that can be printed, each providing a unique perspective on project status and progress. The software allows users to adjust what is included in the printout, such as selecting specific date ranges, filtering tasks, or including additional details like notes or resource names. This feature is handy for creating tangible records of project plans and status updates, which can be essential for audits, stakeholder reviews, and archival purposes.
Standard Reports: In Microsoft Project, standard reports refer to a predefined and custom set of reports available under the "Report" tab that provide various insights into a project's progress and performance. These reports are designed to help project managers and stakeholders quickly understand the status of tasks, resources, costs, and other critical project metrics. Standard reports in Microsoft Project are typically categorized into areas such as:
Overview Reports: These summarize the project's overall status, including critical tasks, upcoming tasks, and project summary details.
Current Activities: These focus on what is happening in the project, detailing tasks in progress, tasks starting soon, and overdue tasks.
Costs: These reports detail cost information, showing planned, actual, and remaining costs for project tasks and resources.
Workloads: These assess how work is distributed among project resources, identifying overallocation or underutilization that might affect project timelines.
Standard reports are not just informative tools; they have customizable features and are easy to print. They are practical aids that can be readily used in meetings and updates. Their role in maintaining transparency is significant, but equally important is their function in facilitating decision-making, a critical aspect of project management.
Visual Reports: In Microsoft Project, a "Visual Report" refers to a feature that allows users to export project data into graphical reports using Microsoft Excel or Microsoft Visio. These reports leverage the advanced visualization capabilities of these applications, such as PivotTables, PivotCharts, and Visio diagrams, enabling a more dynamic and detailed analysis of the project's data.
Visual Reports are designed to provide an enhanced graphical representation of information, making it easier to understand trends, patterns, and relationships within the project. Users can customize these reports in Excel or Visio to suit specific project needs or focus on project management aspects, such as resource allocation, task durations, budget status, and overall project progress.
This feature is helpful in presenting complex project data in a more accessible and interpretable format, facilitating better communication with stakeholders, and supporting more informed decision-making processes.
Screen Capture: In Microsoft Project, the functionalities of Copy Selection, Copy Picture, Copy Timeline, and Copy Report provide various methods for duplicating and sharing specific portions or views of project data. Each feature is designed to help users efficiently share project information in different formats for reports, presentations, or other documentation purposes. Here's a detailed look at each feature:
Copy Selection: This function allows users to select specific rows or data points from a project and copy them. The copied selection can then be pasted into other applications, such as Microsoft Excel or Word, for further analysis, reporting, or sharing. This is particularly useful for creating customized reports or data compilations within a more extensive project dataset.
Copy Picture: The Copy Picture feature enables users to capture a static image of either the current project view or a selected part. The image can be configured to be copied as displayed on the screen, for a printer, or as a GIF file. This is useful for including visual snapshots of project timelines, Gantt charts, or other graphical views in presentations and documents.
Copy Timeline: Copy Timeline allows users to create a visual snapshot of the project's timeline view. This can be particularly effective for presentations or summary reports where a high-level overview of project timelines and milestones is necessary. The copied timeline can be pasted into emails, presentations, or documents to visualize the project schedule concisely.
Copy Report: This feature enables copying entire reports as they are generated within Microsoft Project. Once copied, these reports can be pasted into other documents or applications for further customization or distribution. This is ideal for sharing standardized project reports with stakeholders who may need access to Microsoft Project but need to review project performance and status.
These features enhance the flexibility and efficiency of reporting and communication with Microsoft Project. They make it easier for project managers and team members to distribute relevant project information in various formats tailored to the needs of different audiences.

Exercise 8.1: Create the Communication Network and Reporting Cycle for Your Master Project (30 minutes)
In this first exercise, you will create the communication network for your Master Project and select a Reporting Cycle.
Download
Click the Download icon above to open the Communication Network.docx and the file.
Communication is a key responsibility for project managers, but it is often misunderstood. Even when projects have plans, reports, meetings, dashboards, and presentations, stakeholders still say they do not get the information they need when they need it.
Usually, the issue is not that there is too little communication. More often, the real problem is poor planning.
Good project communication is more than just sending reports or holding meetings. Project managers need to figure out who needs information, what they need, how to share it, how often to send it, and who will handle it. Without this planning, communication can become inconsistent, incomplete, or take up too much time.
A communication network gives you a clear way to manage these needs. It shows who the stakeholders are and how information moves between them. This helps make sure the right people get the right information at the right time and in the right way.
Most project managers and teams start by setting up a communication network, but they often do not include enough detail. For example, saying "I want a weekly status report on completed tasks" is not enough. This tells you what is needed, but not who will write the report, who will get it, how it will be sent, what it should include, how people will understand it, or how it will help with project decisions.
This Activity will help you figure out and organize your project's formal communication needs. You will group stakeholders, decide which communication needs are most important, and set up the information, schedules, formats, and roles needed for good project communication from start to finish.
In the Communication Network.docx file, do the following:
Begin by identifying the three to five most important stakeholder groups in your Master Project.
Group Project Stakeholders. Divide the stakeholders into meaningful groups. The goal is to provide meaningful communication to each group.
Rank Order Stakeholder Groups.
Plan Communication. Identify each group's receiver, sender, information, purpose, and schedule.
Then, embed this file in the Notes field of your Project Summary Task.
Microsoft Project Communication Plan
A Microsoft Project Communication Plan defines how project information will be created, distributed, reviewed, and used throughout the project life cycle. Its purpose is to ensure that stakeholders receive the information they need to make decisions, perform their work, manage risks, and monitor project performance.
A communication plan typically identifies the project stakeholders, their information requirements, reporting responsibilities, reporting frequency, communication methods, and the reports used to communicate project information. In many organizations, this document is called a Communication Management Plan, Project Communication Plan, or Project Reporting Plan.
In Activity 8, the Communication Network, Reporting Cycle, and Reporting Standards work together to form the foundation of a practical communication plan. The Communication Network identifies who needs information and who is responsible for providing it. The Reporting Cycle establishes when information will be collected, updated, reviewed, and distributed. Reporting Standards define the reports, views, dashboards, formats, and communication methods used to communicate project information consistently.
Microsoft Project supports this process by providing views, reports, dashboards, visual reports, and presentation tools that transform project data into meaningful information for stakeholders. Together, these tools help ensure that the right information reaches the right people at the right time.
Reporting Cycle
A project plan during the execution phase is only useful if it reflects what is actually happening. As the team works, they complete activities, encounter problems, adjust their estimates, and use up resources. If there is no clear way to gather and update project details, the plan soon becomes outdated and hard to trust. That’s why every well-managed project needs a reporting cycle.
A reporting cycle is a regular process for gathering project details, updating the project plan, checking progress, reviewing results, and sharing updates with stakeholders. It sets clear times for collecting information, making updates, reviewing performance, and informing everyone involved.
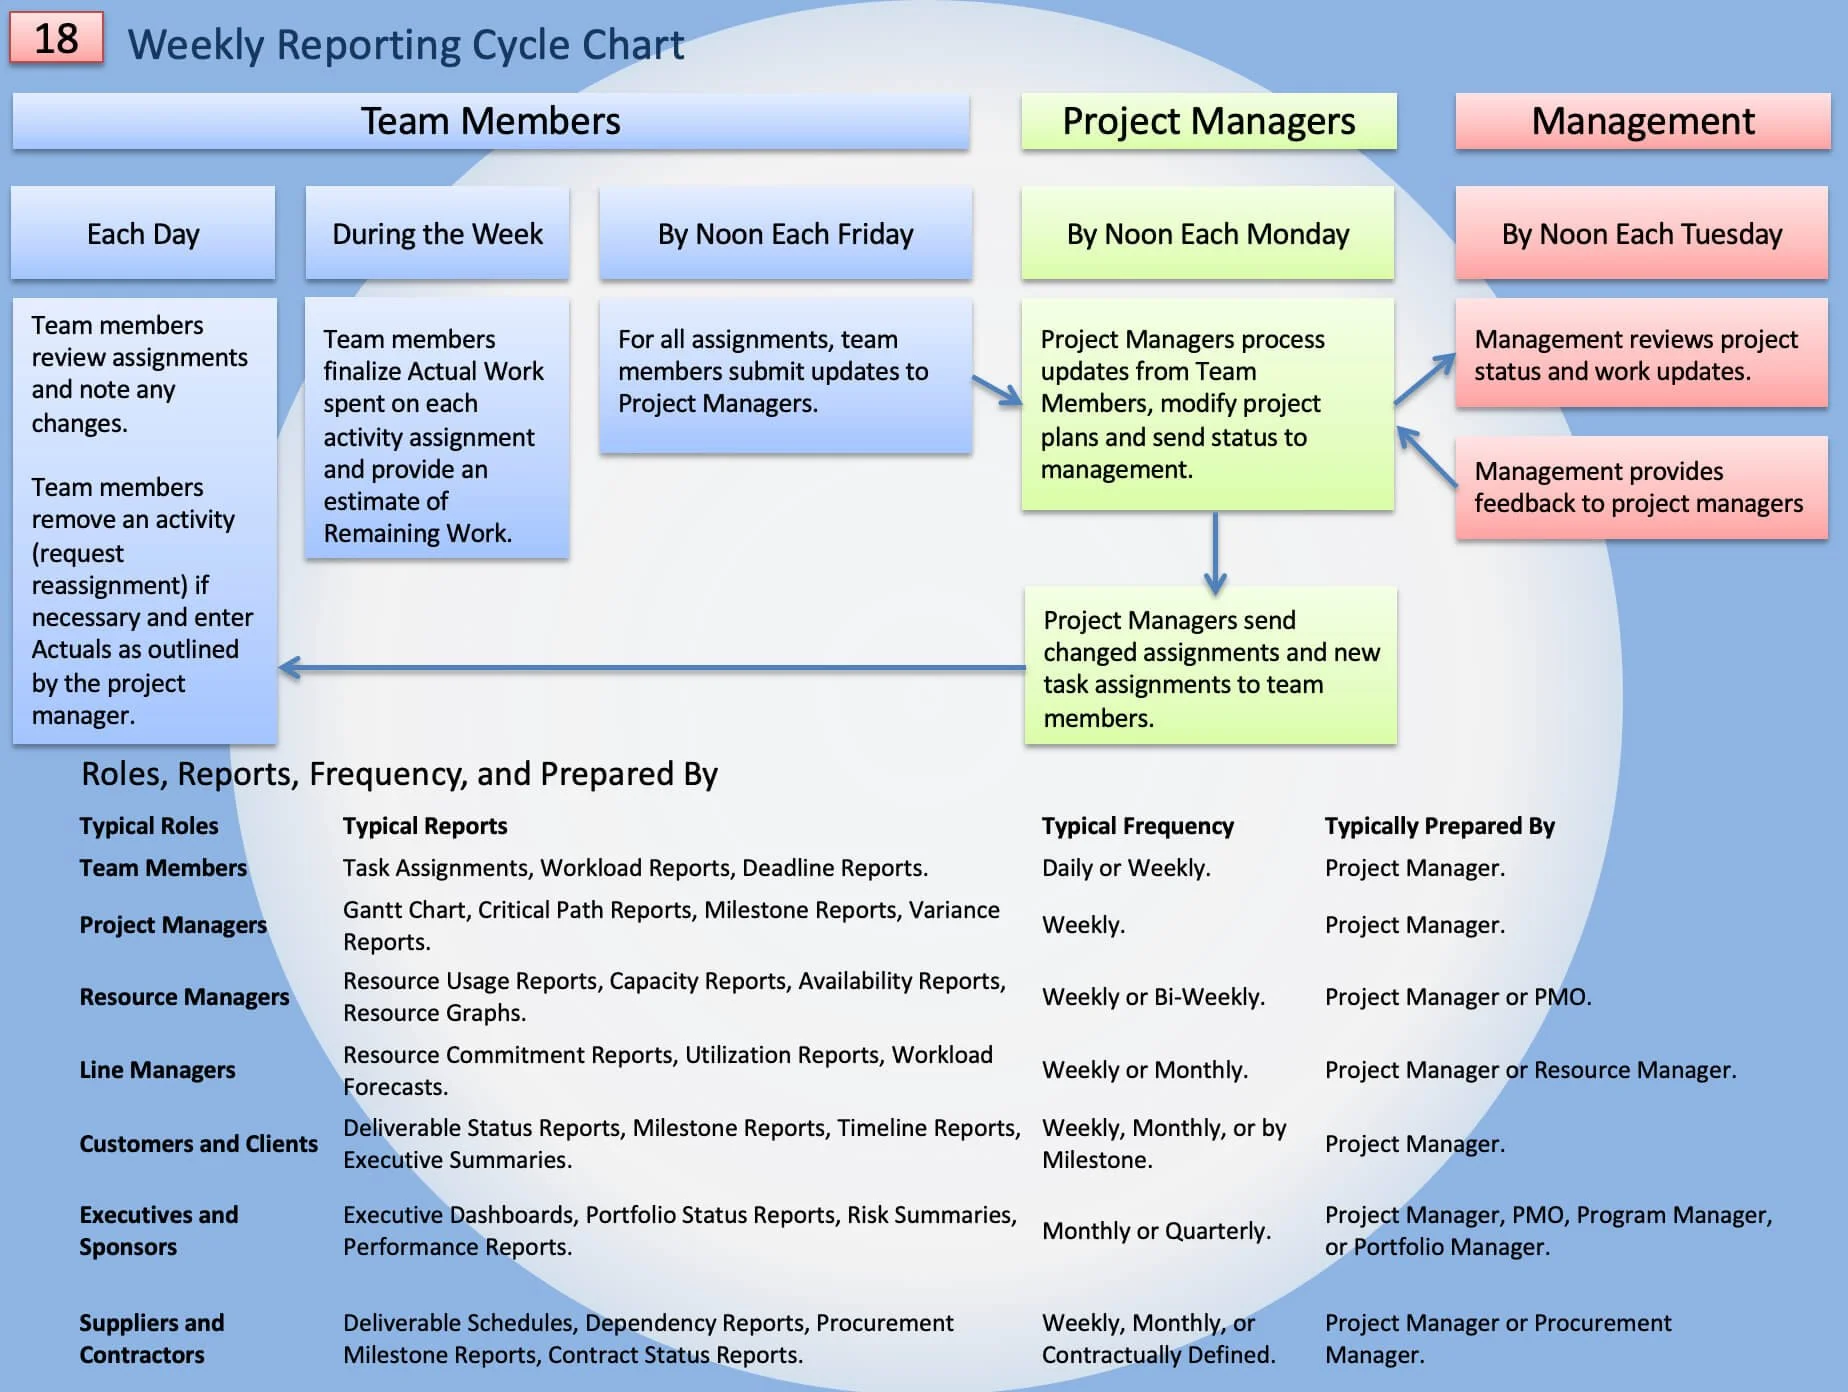
Figure 8.4 Reporting Cycle. This figure illustrates a structured Project Reporting Cycle, showing how project information flows from team members through project managers to management using established reporting frequencies, responsibilities, and report types. Use this reporting cycle to understand how regular project updates, schedule recalculation by the Calculation Engine, report preparation, and stakeholder communication work together to maintain an accurate and current project plan.
In many organizations, project managers spend a lot of time creating schedules but don’t always plan how to keep them up to date. This can lead to updates being gathered at random times, reporting dates changing, and stakeholders receiving outdated or missing information. Even the best project plan loses value if there isn’t a clear process to keep it up to date.
A reporting cycle fixes this by establishing a process the team follows throughout the project. Once in place, the cycle repeats at set times until the project ends.
Established reports are what give a reporting cycle meaning.
For your Master Project, sketch out what you currently think will be your primary reporting cyle. Save this and give it the title, Master Project Reporting Cycle.
When Finished with Exercise 8.1
The communication plan for your Master Project should be defined in the Communication Network.docx. This file and the Master Project Reporting Cycle should be embedded as an object at the project summary level.
(4)
Figure 8.5 Communication Network document embedded at the project summary level. This figure shows a completed Communication Network document embedded as an object within the Project Summary Task of a Microsoft Project schedule. Use this technique to associate supporting project documentation directly with the project file, ensuring that communication plans remain accessible alongside the schedule throughout the project lifecycle.
Exercise 8.2: Review Microsoft Project’s Eight Field Types (20 minutes)
Before creating reports, project managers must understand where Microsoft Project stores project information. Reports do not create data; they organize, summarize, and present data that already exists in the project file. The Project Organization Poster provides a conceptual map of Microsoft Project's underlying information structure, helping you understand how tasks, resources, assignments, costs, dates, calendars, and custom fields work together. Once you understand how information is organized, selecting fields, building reports, and communicating project information becomes much easier.
The Microsoft Project Organization Poster explains that reports, views, dashboards, and Visual Reports all draw information from underlying project fields. The basis of reporting in Microsoft Project is a conceptual understanding of the eight field types and which views display them.
One side of the poster reviews the various views and then lists and categorizes the eight types of fields. The other side of the poster illustrates the eight different Work fields and how each field type functions.
The Microsoft Project Organization Posters A and B are designed to help you get a bird' s-eye view of Microsoft Project’s organization or database structure. A basic understanding of this data organization will help you in reporting and when working with Microsoft Projects.
Figure 8.6 Microsoft Project’s Organizational Structure. This figure presents the Microsoft Project Organization Poster, a conceptual map of Microsoft Project's underlying data structure, including views, reports, tables, field categories, and the relationships between Task, Resource, Assignment, Project, and timephased fields. Use this reference to understand where Microsoft Project stores project information and how reports, dashboards, Visual Reports, and views retrieve data from the underlying field structure.
Download
Click the Download icon above to download the Microsoft Project Organization Posters.pdf and Work.mpp files.
To start this exercise, download the Work.mpp file by using the icon above and opening it in Microsoft Project.
Apply the Task Usage view. Zoom in the timescale to days and move the timescale to Friday right before March 21, 2021, as shown below.
This view shows six different Work fields. Open the Notes for the Project Summary task and identify each field marked A—F in the figure below.
Figure 8.7 Work fields in a Task Usage View. This figure shows the Task Usage view with six different Work fields identified, demonstrating how Microsoft Project displays Task, Assignment, Project, and timephased work values within a single usage view. Use this exercise to distinguish between similarly named Work fields and understand which values are being reported before creating project reports or performing schedule analysis.
Apply the Resource Usage view. There are four different Work fields displayed in this view. Zoom the timescale to daily and move to the same Friday as above.
For each of these Work fields, A - D, marked in the figure below, describe what they are and what they tell you. Enter this information in the Assignment Information Notes field for the Project Manager on the Select Video Cast task.
Save the project when you are finished.
Figure 8.8 Work fields in a Resource Usage View. This figure illustrates the Resource Usage view, highlighting four different Work fields associated with resources and assignments. Use this example to understand how Microsoft Project reports resource-based work information and how the same field name can represent different data depending on the underlying field category.

Tip
If unsure what data a field represents, double-click on the record and observe which Information dialog box opens. It will either be:
Task Information
Resource Information
Assignment Information
When Finished with Exercise 8.2
For the Work.mpp file should have entered these two sets of notes:
In the Project Summary task Notes, you have identified each field marked A—F taken from Figure 8.5 above, in the Task Usage view as shown in the figure below. For example, in Figure 8.5, B is next to a field that shows 88h on a Friday. What field is that and what does that data represent? These are the choices:
Task Work. This represents the total work on a task.
Task Timephased Work. This represents the work on this task on this day.
Project Work. This represents the total work on the project.
Project Timephased Work. This represents the total work on the project on this day.
Resource Work. This represents the total work for this resource.
Resource Timephased Work. This represents the work for this resource for this time period.
Assignment Work. This represents the assignment work.
Assignment Timephased Work. This represents the assignment work for this time period.
In the Assignment Information Notes field for the Project Manager on the Select Video Cast task that is available in the Resource Usage view shown in the second figure below, you have described what each Work field, A—D, marked in the figure above, tells you. For example, in Figure 8.6 above,D is next to a field that shows 8h on Friday. What is that field, and what does it represent?
(3)
Figure 8.9 Exercise results for Work fields in the Task Usage view. This figure shows the completed exercise with the Project Summary Task Notes documenting the identification and explanation of each Work field displayed in the Task Usage view. Use this completed example to verify that you correctly distinguished the various Task, Assignment, Project, and timephased Work fields before continuing to Microsoft Project reporting exercises.
Figure 8.10 Exercise results for Work fields in the Resource Usage view. This figure shows the completed Resource Usage exercise with explanations entered into the Assignment Information Notes field describing each Work field identified in the view. Use this completed example to verify your understanding of Microsoft Project's resource-based Work fields and their role in reporting assignment and resource performance.
Exercise 8.3: Print Views as Reports (20 minutes)
Views are project displays, like the Gantt Chart or Resource Usage views, that can be printed. Reports are purpose-built reporting features found on the Report tab.
In this exercise, you will customize a Resource Usage and print the view as a *.pdf file.
Download
Click the Download icon above and open the Printing.mpp file.
To start this exercise, open the Printing.mpp file.
Let’s suppose you want to print a report on resource work. A line manager has requested a report for each resource’s work, actual work, and remaining work on your project, and they would like to see that information cross-tabulated for just the second quarter.
Apply the Resource Usage view.
Next, since printing a view in Microsoft Project is a WYSIWYG function, let’s set up the view for the report.
Since the manager is only interested in work, filter out the other non-work resources by applying the Resources - Work filter. This filter comes standard with Microsoft Project. Select the View tab on the ribbon / Filter / Resources - Work.
The Unassigned category is still showing. To filter this out, click the drop-down arrow (AutoFilter) next to the Resource Name column header. Uncheck, Unassigned, and the two tasks with no resources assigned are Project Start and Project Finish. If the AutoFilter isn’t showing, select View / Filter / Display AutoFilter to toggle on this filter feature.
You can also sort data in the column by using the AutoFilter. Sort Resource Names from A to Z.
Figure 8.11 AutoFilter used to sort resources. This figure shows AutoFilter applied to the Resource Usage view to sort and filter resources by name and other resource fields. Use this feature to quickly organize resource information, isolate the resources you want to analyze, and prepare customized views for reporting, printing, or further schedule analysis without changing the underlying project data.
Hide the Indicators and ID fields (Hide Column) from the table, and after Resources Names, add the Work, Actual Work, and Remaining Work fields. Remove the rest of the columns by selecting the rest in the table, right-clicking, and Hide Column. The ID field is locked in to hide, edit the table, and remove and uncheck the Lock first column.
You can also use the Bridge Quick Access Toolbar to quickly add or hide columns without much clicking.
Figure 8.12 Bridge Quick Access Toolbar. This figure illustrates the custom Bridge Quick Access Toolbar, providing one-click access to frequently used Microsoft Project commands for reporting, formatting, adding or hiding columns, and managing views. Use this customized toolbar to reduce repetitive ribbon navigation and improve productivity while preparing project reports and analyzing schedule information.
Best fit the first four columns: Resources Name, Work, Actual Work, and Remaining Work. Center the data in the Work, Actual Work, and Remaining Work columns.
Next, set up the timescale. The manager requested to see the work values weekly. Select the View tab on the ribbon, zoom in on the Entire Project, and select Weeks in the Timescale dropdown. The timescale should show Months and then Weeks. If not, move your cursor to the timescale, right-click, choose Timescale, and select Months in the Middle Tier tab. In the Bottom Tier tab, select Weeks.
Work details are already showing in the timescale, to add Actual Work and Remaining Work, click Resource Usage Format on the ribbon, and add the timephased Actual Work by checking the Actual Work command in the Details group. Remaining Work is not listed, click the Add Details command and scroll the list of available timephased fields on the left. Remaining Work is not available! Double-check Poster A - Microsoft Project Organization, which can be downloaded above, and notice that Remaining Work is unavailable. In addition, there are no timephased custom columns available in Microsoft Project, so that field can not be customized. There is, however, a Remaining Cumulative Work field available. Add that field instead.
Microsoft defines Remaining Cumulative Work as:
Remaining Cumulative Work = Total Work – Cumulative Work
Best Uses Add the Remaining Cumulative Work field to the timephased portion of the Resource Usage view to review remaining cumulative work information for a resource. This allows you to see how much total scheduled work remains to be completed for a resource at a given point in time.”
When looking for a particular field, resist the urge to say, “Damn, it isn’t there!” Search the Poster or search online with something like “Microsoft Project available fields.” Likely, the field is named differently than you thought, or there is a field that might even work better for you. You can also give Microsoft support a shot. I am currently conversing with the senior engineer Mr. Raymando Rayappan, and he has been delightful and helpful. He reached out to me based on a question I had asked in an online chat session at Microsoft 365 support.
While in Add Details, make the cell background of Work bright yellow and Remaining Cumulative Work a light blue or grey.
Show this field if you do not have All Assignment Rows in Add Details. In a Usage view, there are several types of records. In the Resources Usage view, the two primary records are Resources and Assignments. The All Assignment Rows field allows you to break these out visually in the timescale area.
Make sure you show this field and make the background a very light green.
Figure 8.13 Exercise results, Resource Usage view sorted by Resource Names. This figure shows the completed Resource Usage exercise with resources sorted alphabetically, weekly timescale formatting applied, and Work, Actual Work, and Remaining Cumulative Work displayed in the timephased portion of the view. Use this completed example to verify that your reporting view is correctly configured before printing or sharing resource workload information.
This view is almost ready for printing. To print preview, select File / Print. Print preview is the next screen. You can choose your printer driver, edit a date range to print, and make selections in page setup.

Note
What you see is also a function of the printer selected. In this example, an HP LaserJet Pro is selected.
To print only the second quarter date range, set the Dates to 4/1/2021 through the end of the project or 6/9/2021.
Select Page Setup and complete the following:
On the Left side of the Header, Add the Project Current Date from the General dropdown menu. Underneath that line, type in Resource Work Report and make it bold and dark blue.
On the Center of the Header, Add Work and then Actual Work on the next line. Type in the label for each field before the & symbol. Like this: Work &[Work], otherwise only the data will show, and the reader may not know what it represents.
Add % Work Complete and Remaining Work on the Right side of the Header, and type in a label for each field.
Figure 8.14 Page Setup in Microsoft Project. This figure shows the Page Setup dialog used to configure page layout, margins, headers, footers, legends, view options, and print scaling before printing a Microsoft Project view. Use this dialog to optimize printed schedules so they are readable, professionally formatted, and appropriately scaled for stakeholders.
Also:
Remove the Borders in the Margins tab.
In the View tab, uncheck every item.
Play with the Zoom on the Page tab and see if you can adjust the report to being no more than 3 pages but still legible.
Save the project.
Figure 8.15 Printing views and making selections in Print and Page Setup. This figure illustrates the Print preview window together with Page Setup options used to select printers, define print ranges, preview output, and create PDF versions of Microsoft Project reports. Use this feature to verify report appearance before printing or publishing schedules electronically as PDF documents.
What if you want or need to print the report as PDF?
There are two ways to do this. First, you can export it as a PDF file. In general, this is not the best solution. The best option is if you have a PDF printer driver listed under Printer, like Adobe or Microsoft Print to PDF. If you can print this report to a PDF driver, name the file Printing.pdf.
When Finished with Exercise 8.3
Your Printing.pdf file should look similar to the one below.
A - It is less than four pages.
B - Resource Name is sorted A - Z.
C - These fields are shown with the data, centered in the columns.
D - This date range is displayed.
E - These Details are included.
F - A similar color scheme is applied.
G - These fields and similar formatting and color schemes are in the header.
(3)
Figure 8.16 Microsoft Project Backstage Print page. This figure shows the Backstage Print page in Microsoft Project, where you can preview the printed output, select a printer, specify page ranges, adjust print settings, and access Page Setup. Use this page to review the appearance of your schedule before printing or exporting it as a PDF to ensure reports are accurate and professionally formatted.
Best Practice
For Views that you print out routinely, create a custom view with all of the other custom elements associated with the view, such as tables and filters, and use those elements for just reporting. Consider naming the custom elements the same name as the report.
Page Setup for printing is saved with the view, so sharing views with other projects or users also shares that setup.
Exercise 8.4: Create and Edit Standard Reports (40 minutes)
Microsoft Project reports do not create project information. Reports organize, summarize, and present information already in the project file. The quality of a report depends on the quality of the underlying project data.
In this exercise, you will complete a three-page standard report with a table and several bar charts. In addition, you will print the report as a *.pdf file and share the report with your Master Project.
Click the Download icon above to download and open the Chart 4-Standard Reports.pdf and the Standard Reports.mpp files.
First, review the Chart 4-Standard Reports.pdf file. This chart provides an overview of this reporting feature in Microsoft Project.
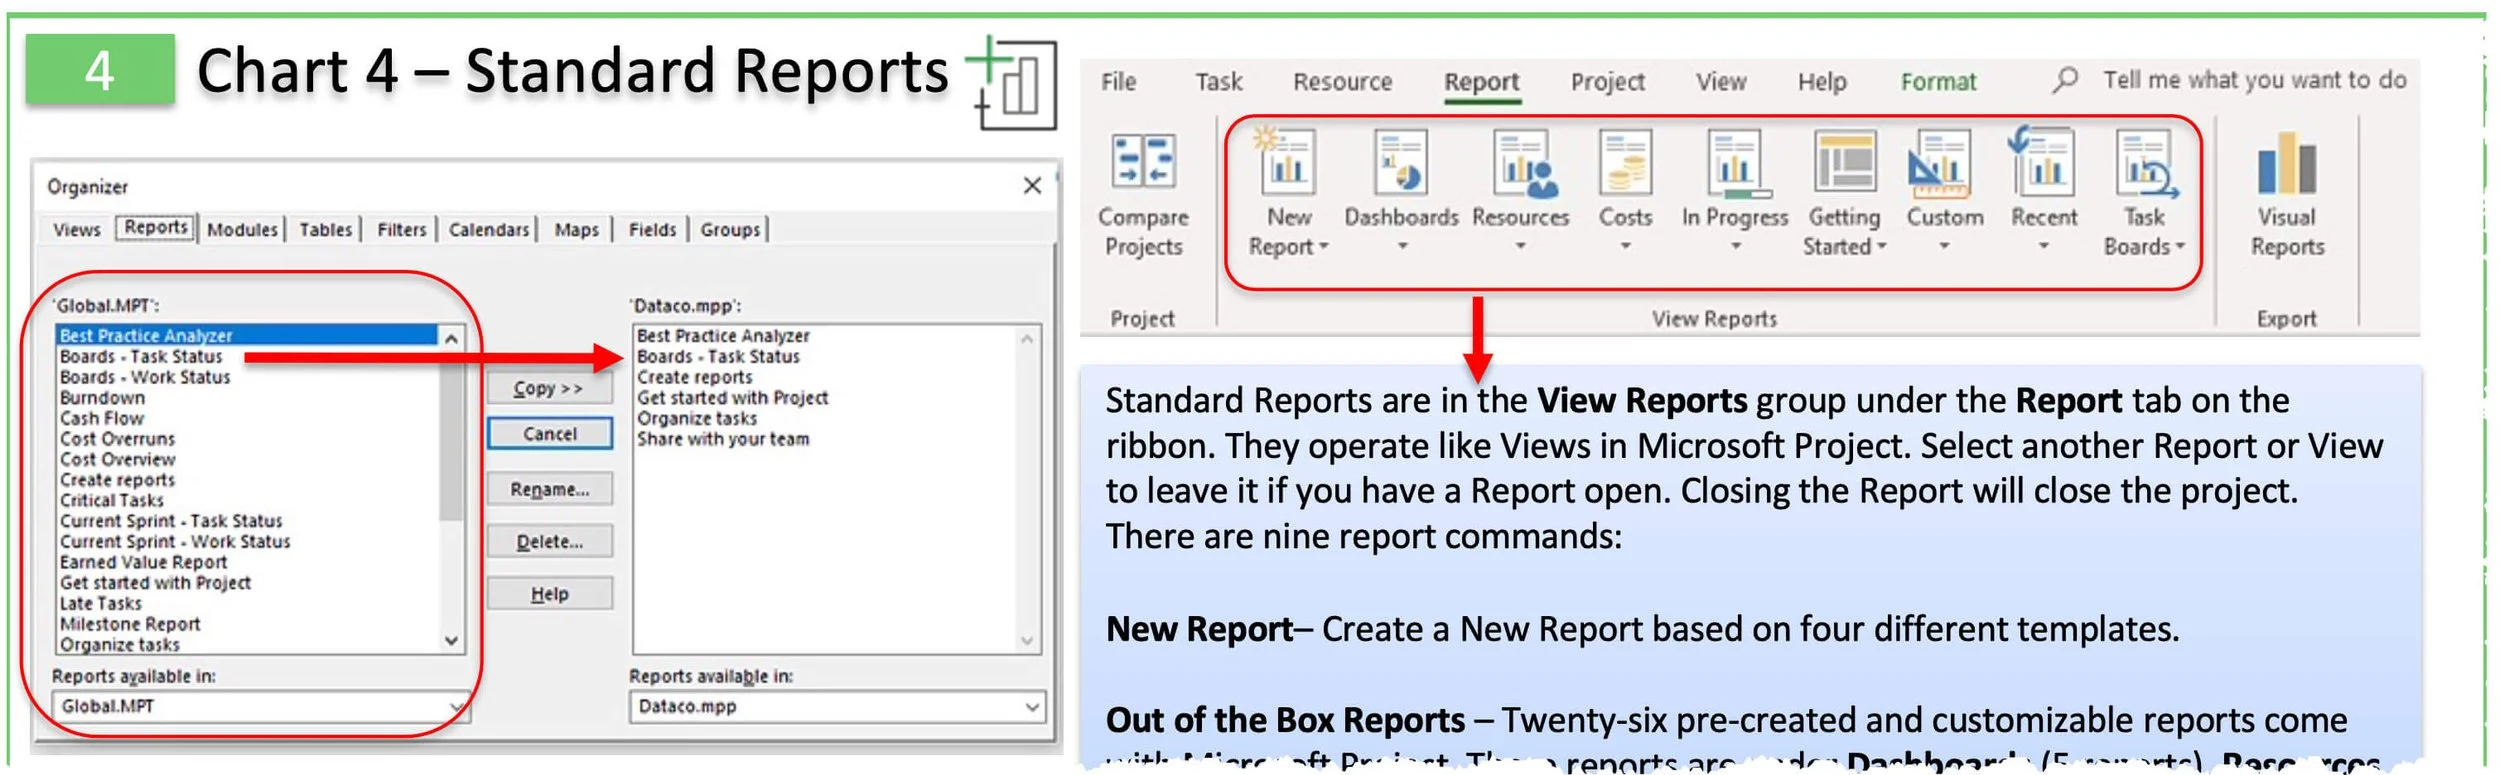
Figure 8.17 Chart 4 – Guidelines for Standard Reports. This figure presents Chart 4: Guidelines for Standard Reports, which summarizes the recommended characteristics of effective project reports, including report purpose, intended audience, reporting frequency, level of detail, visual clarity, and consistency. Use this guide to develop standardized Microsoft Project reports that communicate meaningful schedule information, support project decisions, and provide stakeholders with consistent and actionable information.
Open the Standard Reports.mpp file.
Let’s suppose your company is developing this custom training program for Apple retail salespeople nationwide. You want to print a weekly report on resource work and the work and cost status for the major phases of the project. The people attending the status meeting want the report in 8.5 X 11 format.
Click on the Report tab, click the Recent command, and open the Resource Overview report.
You started this report last week when you were just going to report on work. Now, people want the project's work and cost status, so rename the report to Work and Cost Status. You can do that by going to the Reports tab in Organizer or clicking the Design tab, selecting the Manage command, and renaming the Report.
Start on the right foot by showing Page Breaks in the Page Options group under the Report tap and clicking the Page Setup command. Make sure the report is in Landscape Orientation.
In the Text Box next to the Apple logo, type Work and Cost Status Report. Apple’s corporate colors are black and gray, so we will work with those colors so that the report has, from our perspective, the look and feel preferred by the customer.
On the first page, there is a table that includes work information. Select the table and then add the fields below in the Table Data panel. Add them in this order:
Cost
Actual Cost
Remaining Cost
Cost Variance
As already mentioned, these tables are not easy to work with, it is best to predetermine the fields you want in the table and then add fields (columns) right to left.
Arrange the rows and columns appropriately. The Layout tab has a Cell Size group, but I have found that manual adjustments often work best.
Figure 8.18 Adding fields to a table in Standard Reports. This figure shows the Table Data pane used to add fields to a table within a Microsoft Project Standard Report. Use this feature to insert additional project fields—such as Cost, Actual Cost, Remaining Cost, and Cost Variance—so reports present the information stakeholders need for monitoring project performance and making informed decisions.
Note
When working with these reports, the undo and redo commands are available. If you mess up a table by trying to adjust the cells, just click undo and try again.
The table shows Outline Level / Level 1, and the variances in the Work and Cost Variances fields are easy to see. In Microsoft Project, positive and negative variances are the opposite of how we think about them when reviewing project status. A positive variance regarding cost, for instance, is actually a negative variance in most people’s minds.
Since this project does not include many tasks, the Outline Level shows Level 2 and Show Hierarchy. This added detail tells a better story or provides a more complete status explanation. Use the Table Design tab / WordArt Styles group / Text Outline command to highlight positive variances in red and negative variances in blue. You could also select the Task tab on the ribbon and use the Font group to highlight text.
It would be great to show the Project Summary task, but the table doesn’t fit well with that added level in the Hierarchy, so let’s add another table and just show the Project Summary. As shown in the figure below, this will make the project summary task visible.
Select the table, Copy it, and then Paste it. In the Outline Level, select Project Summary. In the second Design tab / Table Style Options, uncheck the Header Row command and arrange the two tables as shown in the figure below.
Format the positive variances in bold red.
if Word Art has been applied to any fields, this may not be possible. Word Art can be cleared in the second Design table under the Quick Styles command.
Be sure the table, logo, and text box fit on the first page.
This completes the first page of the report.
Figure 8.19 Using two tables to show the Project Summary task and the project tasks to Level 2. This figure demonstrates how two separate tables are used within a Standard Report to display both the Project Summary Task and Level 2 project tasks. Use this technique when a single table cannot effectively display summary and detailed information together, allowing executives to quickly review overall project performance while still providing sufficient detail for project managers and stakeholders.
In the next part of the report, you want to chart resource Work-related status and resource % Work Complete. These are two different data types, so you will need two charts. In addition, the current chart in the report is too busy. You will not be able to fit all the resources on the same chart, so you will place half the resources on one chart and the other half on the other.
First, size the chart to fit on the page. Then, add a Text Box in the Design tab and title it Resource Work Status.
We could use many custom fields, such as the Flag fields, to filter the resources into two different categories for this chart. However, since the Group field is not being used and there is already a filter for Group, let’s use that field.
Go to the Resource Sheet view in Microsoft Project. Sort the Resources by Name and then enter the letter A for the first five Work type resources and the letter B for the next four. The non-Work type resources are left blank since they do not have work, so there is no reason to show them in the chart.
Figure 8.20 Sorting in the Resource Sheet view. This figure shows the Resource Sheet view with resources sorted alphabetically and assigned to Group A and Group B for reporting purposes. Use this approach to organize resources before filtering and creating separate charts or reports, making Standard Reports easier to read and more meaningful for stakeholders.
Return to the report and select the chart. Change the chart to appear like the one in the screen below. Chart Design tab / Change Chart Type command.
Figure 8.21 Changing a chart using the Change Chart Type command. This figure shows the Change Chart Type command used to modify the appearance of a chart within a Microsoft Project Standard Report. Use this command to select the chart style that best communicates project information, making resource workloads, costs, and schedule performance easier for stakeholders to interpret.
Next, in the Chart Data panel, Filter for Group A (enter the A group name) and then Sort By / Custom Sort / Name / Descending.
Figure 8.22 Filtering and then sorting data in a Standard Report chart. This figure demonstrates how to filter chart data by resource group and then sort the remaining records within a Microsoft Project Standard Report. Use this technique to create focused charts that display only the information relevant to a particular stakeholder group while improving chart readability and communication effectiveness.
Select the chart, click the plus symbol to the upper right of the chart (Chart Elements command), and check these items:
Axis
Data Labels
Data Table
Gridlines
Last, format the bar colors. Select a Work bar; NOTICE: All other work bars are selected. Right-click and fill in black. Click so that all Work bars are selected, not just the bar for a particular resource. Format Actual Work in light gray and Remaining Work in dark gray.
This completes the chart for those resources in Group A.
This second page in the report should look like the one in the figure below.
Figure 8.23 Formatting a chart in Standard Reports. This figure shows a completed Standard Report chart after formatting chart elements, colors, labels, gridlines, and data tables. Use this formatting process to improve readability, reinforce organizational branding, and present project information in a professional format suitable for management reviews and stakeholder presentations.
Next, duplicate this chart on the next page and filter for Group B. Do this by selecting this chart and the Text Box title. Copy / Paste (keep the Source Formatting), and then drag the pasted chart and title to the next page. Remove the Group filter, apply the Group filter, select the B group, and then Sort.
The chart on the third page of the report is identical to the second page, except it is filtered to show resources in the B group.
Save the project.
Tip
When moving inserted items, zoom out; it makes it easier to click and drag items to a new page.
On the last page, the 4th page, create a chart that charts % Work Complete for resources.
For the % Work Complete Chart on the next blank page in the report, duplicate the chart in the screen below by doing these things:
Inserting a new chart and selecting the correct style.
Select the chart, the Resources Field List, and Filter for Work Type resources.
Select only % Work Complete.
Format in black.
Select the Chart, select the Task tab on the ribbon and change the font to Calibri / 10pt / black.
Select the Axis, Chart Title, Data Labels, and Gridlines elements.
Be sure to add a text title.
Figure 8.24 Formatting a resource-based chart in Standard Reports. This figure shows the final formatting of a resource-based % Work Complete chart within a Microsoft Project Standard Report. The chart has been configured to display only Work resources, formatted using a consistent corporate color scheme, and enhanced with chart elements such as the Axis, Chart Title, Data Labels, and Gridlines. Use this example to create executive-quality reports that clearly communicate resource progress while maintaining a consistent reporting standard throughout the project.
So far, your report should include:
Two tables on the first page.
A chart on the second page shows work information for Group A resources.
The same chart appears on the third page but shows work information for Group B resources.
The % Work Complete chart on the fourth page shows all resources and the percentage of work completed.
All color schemes should be a close match.
Reports can be printed as a *.pdf file and then shared.
Print Preview (File / Print): select the Microsoft Print to PDF driver or your choice of PDF print driver. Then do the following to complete this report:
My report is printing 8 pages, and I can't figure out why. To solve the problem, I selected pages 1 - 4. I also reduced the size of the report to 97%, which seemed to better position the tables and charts on the pages.
Don’t show a Border around Every Page.
Add a Page Number, Project Title, Date, and your name to the Center of the Footer.
In the Page Setup View tab, you will notice that there is no way to prevent the printing of blank pages. If blank pages are shown in the print preview, your tables and charts will have to be rearranged. Move the charts around to remove the blank pages.
Print your project and give it the file name Work and Cost Status Report.pdf, and then Save your project.
Last, use the Organizer to share your Work and Cost Status report with your Master Project.
Figure 8.25 Print preview of the Standard Reports. This figure illustrates the Print Preview window used to review the completed Work and Cost Status Report before creating a PDF. It demonstrates selecting a PDF printer driver, adjusting page scaling, verifying page layout, removing unwanted blank pages, and confirming footer information before publication. Use this process to ensure Microsoft Project reports are professionally formatted and ready for distribution to stakeholders.
When Finished with Exercise 8.4
You created the Work and Cost Status report in the Standard Reports.mpp file.
The Work and Cost Status Report.pdf file should look similar to the one in the figure below.
The report should be four pages long.
Each chart and table is neatly positioned on each page.
Each chart and table has a text title.
The correct footer information is printed on each page.
Last, you shared this Work and Cost Status report with your Master Project.
(3)
Figure 8.26 Printing a report as PDF. This figure shows the completed Work and Cost Status Report after being printed as a PDF, including four professionally formatted pages containing project summary tables, resource work charts, and % Work Complete charts. Use this completed example to verify that your report layout, formatting, pagination, and charts match the expected results before sharing the report with stakeholders or importing it into your Master Project.
Best Practice
Use the Organizer to manage your reports, make them available for other projects, and share them with other users.
Exercise 8.5: Create Visual Reports (30 minutes)
This exercise will examine Visual Reports. Although project data can be exported to Visio, Visual Reports' primary purpose is to export multidimensional data to Excel for further analysis or reporting.
In this exercise, you will create a new Visual Report template.
Standard reports and dashboards help share project status, but sometimes project managers need more advanced ways to analyze and report data. Microsoft Project meets this need with Visual Reports.
With Visual Reports, you can export project data to Microsoft Excel or Visio. There, you can analyze, summarize, and present information using more advanced tools than those in Microsoft Project. This is especially helpful when stakeholders want custom charts, detailed calculations, trend analysis, or high-quality graphics.
When you create a Visual Report, Microsoft Project exports selected project information into an OLAP cube. This cube organizes your data so you can analyze it from multiple angles, including time, resources, costs, assignments, and work performance. The cube is the base for reports in Excel and Visio.
In Excel, Visual Reports usually use Pivot Tables and Pivot Charts. Pivot Tables help project managers quickly summarize lots of data, group it by category, calculate totals, compare actual and planned values, and spot trends. Pivot Charts turn this information into visuals, making it easier to share results with stakeholders.
Visual Reports are especially useful for several types of project analysis:
Resource Analysis lets project managers check resource use, workload, actual and remaining work, and resource availability.
Cost Analysis helps review planned, actual, and remaining costs, as well as budget performance and cost trends during the project.
Schedule Analysis lets project managers examine work distribution over time, milestone completion, schedule performance, earned value, and other indicators of project progress.
Microsoft Project comes with many built-in Visual Report templates, and organizations can also make their own to fit their needs. Once you create a template, you can use it across different projects, helping standardize reporting and keep communication consistent.
Visual Reports are one of the most powerful reporting tools in Microsoft Project because they combine its scheduling features with the analysis and presentation strengths of Excel and Visio. For project managers who often share project performance with executives, customers, or stakeholders, Visual Reports can be an essential part of communication.
Download
Click the Download icon above to download the Visual Reports.mpp file.
Once you open the Visual Reports.mpp file, the Visual Reports command is located under the Report tab.
Visual Reports occasionally fail because of Microsoft Office configuration issues rather than user error.
Figure 8.27 Visual Reports in Microsoft Project. This figure shows the Visual Reports command on the Report tab and the Visual Reports – Create Report dialog box. From this dialog, project managers can select built-in Excel or Visio report templates, choose the level of time-phased data to export, and create custom Visual Report templates. Use this feature when you need advanced analysis, PivotTables, PivotCharts, or executive-level reports beyond the capabilities of Standard Reports.

Warning
Before we get started, I want to mention that Visual Reports has had occasional problems since Microsoft Project 2010. In my experience, it usually works fine for a long time, but sometimes stops working after an update to Microsoft Office, Project, or Windows. After reviewing many discussion threads and support posts, I’ve found that the most common fixes are to install the latest update, roll back to a previous update, or switch to a different version of Microsoft Project or Office.
From what I’ve seen, Visual Reports, VBA, and a few calculation settings in the Options dialog box are the main features in Microsoft Project that tend to cause technical issues. Otherwise, Microsoft Project is very stable and reliable, especially compared to other Microsoft Office products. I’ve used it on large, complex projects over the years, and it has usually worked very well.
Before you spend time learning how to use Visual Reports, make sure it works on your system.
To test Visual Reports, open its dialog box, pick any Excel report, and click View. If everything is working, Microsoft Project will build the OLAP cube and open Excel with your chosen report.
If the cube-building process starts but you receive an error message, Visual Reports is not working properly. A common error message says:
"You will not be able to run this simulation until the issue is resolved."
If you get an error message, you’ll need to decide if it’s worth the time to troubleshoot. For most project managers, the built-in reports, dashboards, views, tables, groups, and filters in Microsoft Project are usually enough. Visual Reports is helpful, but you don’t need it to plan, manage, or report on your projects successfully.
Figure 8.28 Visual Reports error message. This figure illustrates a common error encountered while generating a Visual Report after Microsoft Project begins building the OLAP cube. The example demonstrates that Visual Reports can occasionally fail because of Microsoft Office or Microsoft Project configuration issues rather than project data errors. Use this figure to recognize Visual Reports configuration problems and verify that the feature is functioning correctly before investing time creating custom report templates.
Visual Reports are export routines. These routines are saved templates; you can create and edit new templates. In this simulation, we are going to create a new Excel template.
If you have not worked with Visual Reports, open Visual Reports, explore the functionality of the Visual Reports dialog box, and run or view several of the reports.
We are going to create a new template to run a common report that is no longer available in Microsoft Project but was once a popular resource report. We will call this report Who Does What When.
You will see the value in this report as we create this report. The report will show the actual work for each resource, which will be cross-tabulated over time. This report is like a Resource Usage view we worked with above in this Activity. The advantage of exporting is that it allows for the manipulation, analysis, and formatting of data sets in Excel in ways that are impossible in Microsoft Project.
However, one weakness in the export is that Microsoft Project does not export the actual dates. The timescale will show Years, Quarters, Months, Weeks, and Days but not the actual dates for Weeks and Days. These are the Calendar export options:
Years = Years
Quarters = Years and Quarters
Months = Years and Months (likely, the most reasonable export)
Weeks = Years, Quarters, and Weeks (Weeks are numbered and do not include dates)
Days = Years, Quarters, Weeks, and Days (Weeks and Days are numbered and do not include dates)
The one calendar option that is not available and that I think is the most important is Years, Quarters, Months, and Weeks.
These calendar options will become clearer once you run some reports.
Who Does What When Excel Report: Creating a New Visual Reports Template In Three Simple Steps
Step 1: Create the Type of Template
Open Visual Reports under the Report tab on the ribbon.
Select the Calendar or usage data to export. The options are Years, Quarters, Months, Weeks, and Days. Each time the report is viewed or run, a different calendar can be selected. Select Months. In the Visual Reports—Create Report dialog box, look for the selection Select level of usage data to include in the report.
Select the New Template button.
Select the Excel radio button.
Select Resource Usage in the dropdown menu, the data category to export.
Note
This should be starting to gel by now. You know that Microsoft Project has four primary types of records. The resource usage view has two primary types of records: resource records and assignment records. Both types are cross-tabulated or time-phased. You will create an Excel report that lists all the resources and shows when they are working.
Next, Select the Field Picker button and the fields you want to export. The fewer fields, the faster the multidimensional build and export. This report only needs three fields: Work, Actual Work, and Type. Since this is a Work report, we want to be able to filter out non-work resources, so we will do that with the Type field. Click the Remove All button and then Add the three fields. If you already show a lot of fields, it is easiest to Remove All and add the three fields.
When finished, click OK and then OK. The report is then built and opened in Excel.
Figure 8.29 Creating a new Visual Report. This figure demonstrates the process of creating a new Excel Visual Report template, including selecting the report type, choosing the Resource Usage data category, defining the calendar level, and selecting exported fields using the Field Picker. Use this process to create reusable Visual Report templates that export only the information required for advanced reporting and analysis.
Step 2: Setup the PivotTable in Excel
Using the figure below as an example:
A - Check all fields exported.
B - Move the resource Type field to the Filters box.
C - Apply the Type filter and select Work to show that resource type.
D - Unselect resources, such as Unassigned.
Figure 8.30 Setting up the PivotTable in Excel for a Visual Report. This figure shows the exported Excel PivotTable after a Visual Report has been generated. The Type field is moved to the Filters area, filtered to display only Work resources, and unnecessary records such as Unassigned resources are removed. Use this configuration to produce cleaner, more meaningful PivotTables that focus on active project resources.
Step 3: Format the Pivot Table in Excel
For example, you could do the following:
Remove decimals for Work, Actual Work, and totals by selecting a field and then selecting the PivotTable Analyze tab / Field Setting command in the Active Field group / Number Format.
Select a style under the Design tab.
Make selections you find interesting in the Layout group under the Design tab.
Apply a Theme under the Page Layout tab.
Format cells and add calculations if desired. Do not disrupt the PivotTable in the template or restrict its movement to the right or the bottom, like the Remaining Work calculations in the screen below.
Figure 8.31 Formatting the Pivot Table in Excel. This figure presents a completed Who Does What When Visual Report after formatting has been applied in Microsoft Excel. Number formats, PivotTable styles, themes, calculated fields, and conditional formatting improve readability while preserving the PivotTable's ability to refresh automatically from Microsoft Project. Use this approach to create professional Excel reports that communicate resource workloads clearly and consistently.
Step 4: Save as a Template
First, save as an Excel Template. The default location typically is C:\Users\YourUserName\AppData\Roaming\Microsoft\Templates.
Name the Template “Who Does What When.”
When prompted, select Yes to have Excel clear the data and automatically refresh the data when the template is opened.
Exit Excel, close Visual Reports in Microsoft Project, and open again. You should see the Excel Template you just saved.
Note
In some cases, the user's settings may default to hide the AppData folder, so they may not be able to easily find this template after it's saved in that location. Follow these steps to "unhide" it:
Navigate to C:\Users\YourUserName
Click the "View" tab at the top of the file network window
Check the box next to "Hidden Items"
The AppData folder should appear in the list now
Figure 8.32 Message to clear data and automatically refresh when the template is used. This figure shows the Microsoft Excel prompt asking whether to clear the existing project data before saving the workbook as a reusable Excel Template (.xltx). Selecting this option allows the template to refresh automatically whenever it is opened by Microsoft Project. Use this setting to create reusable Visual Report templates that always display current project information.
Figure 8.33 New templates will show in the All tab. This figure shows the newly created Who Does What When Visual Report template appearing in the All tab of the Visual Reports – Create Report dialog box. If the template does not appear automatically, the Modify button can be used to browse to the template location. Use this dialog to verify that your custom Visual Report template has been successfully saved and is available for reuse in future Microsoft Project files.
If you do not see the template you just created, click the Modify button and select the location of the template file. Then, you can test this template by opening another project with resource assignments and running the Who Does What When Visual Report.
When Finished with Exercise 8.5
Take a screen capture of the Excel template file like in the figure above. You can Press Ctrl + PrtScn keys or use a capture app.Name the file Visual Reports.jpg. Use any common extension like tiff or png.
(3)
Exercise 8.6: Copy Picture, Timeline, or Report (30 minutes)
If you started this MS Project Master Class from the first chapter, this exercise is an in-depth review of the screen capture feature in Microsoft Project called Copy Picture.
In this last exercise on reporting, we will look at the different options for Copy, Copy Picture, and Paste.
Download
Click the Download icon above to download the Copy Picture.mpp and the Status Presentation.pptx files.
In many types of reporting, both formal and informal, you will want to take a snapshot of some aspect of your project and paste it into an email, PowerPoint slide, or other document.
These various Copy, Copy Picture, and Paste features work better or worse depending on your goal. Being familiar with the options will help you quickly decide what is likely to work best.
In this simulation, you will Copy a Timeline view, a Gantt Chart View, and a Standard Report into three slides of the PowerPoint file you downloaded.
Timeline View Copy
Apply the Timeline view to the Copy Picture.mpp. In this view, the remaining project phases are included in the Timeline. The last two Phases are in Callout and highlighted in red. Let’s say you would like to be able to show the status data on the timeline, so a workaround is to open Project Information on the Project tab and type in the Status Date in the Current Date field. The Today field shows the information from the system clock, but you can temporarily enter any date you want.
The Copy Timeline is the capture feature for this type of view. The figure below shows three optimized types of capture. A safe assumption is that the For Presentation is the best selection to try first since you will be pasting it to PowerPoint. However, depending on many variables, the logical selection is not always the best capture selection. You might try all three to determine what works best.
Click the Format tab, and then select the Copy Picture command and make a selection.
Figure 8.34 Copy Picture command in the Timeline view. This figure shows the Copy Timeline command on the Format tab while viewing the Timeline. The command provides optimized output options for email, presentations, and full-size graphics. Use this feature to create high-quality timeline images that communicate overall project status without exposing unnecessary scheduling details.
When using Paste, you have three options to select from: Use Destination Theme, Keep Source Formatting, and Picture.
Paste this Timeline into slide three of the PowerPoint deck. To get the best results, you might try several approaches.
On my device, with my operating system and my software versions, I found that the best result for this presentation was: Copy / Full Size and Paste / Picture.
Figure 8.35 Pasted Copy Picture of Timeline view. This figure illustrates a Timeline copied from Microsoft Project and pasted into a Microsoft PowerPoint presentation. It demonstrates how Timeline graphics can provide executives and stakeholders with a concise visual summary of project phases and current status. Use this technique to communicate high-level schedule information during meetings and presentations.
Copy Picture a View
Apply the Gantt Chart view. We will copy and paste this view into PowerPoint, but first, let’s set something up.
Apply the Incomplete filter only to show tasks that are not 100% complete.
Adjust the pane divider between the table and the taskbars to ensure all five columns are showing.
The Status date is shown as a red vertical line in the taskbar area of the window. Move that line close to the pane divider and zoom the project to fill the available space in the window.
We are not going to do this, but you can copy and paste the tasks. This is a good option when you just want to paste a table of data, as shown in the figure below. When the target is a slide in PowerPoint, you can select from four different types of paste.
Figure 8.36 Selecting and pasting tasks. This figure demonstrates selecting tasks in the Gantt Chart view and using the standard Copy command before pasting them into Microsoft PowerPoint. Unlike Copy Picture, this method transfers task data rather than graphical taskbars. Use this option when stakeholders need editable task information instead of a visual schedule.
When you want to show tasks bars, Copy Picture is the best capture option. This command is found under the Task tab in the Clipboard group.
Select all of the tasks in the Gantt Chart view, and then click Copy Picture and make the same selections shown below in the Copy Picture dialog box.
Figure 8.37 Copy Picture command in a view. This figure shows the Copy Picture dialog box used while viewing a Gantt Chart. The dialog allows project managers to capture the screen, selected rows, or a specified date range for presentation-quality graphics. Use this command when you need to preserve both tabular data and Gantt bars as a single image for reports or presentations.
When pasting into PowerPoint, there are two selections. Paste this picture into slide number four.
Figure 8.37 Copy Picture command in a view. This figure shows the Copy Picture dialog box used while viewing a Gantt Chart. The dialog allows project managers to capture the screen, selected rows, or a specified date range for presentation-quality graphics. Use this command when you need to preserve both tabular data and Gantt bars as a single image for reports or presentations.
Standard Report Copy
The last copy we are going to do is the Copy Report command for Standard Reports. Open the Critical Task report under the Report tab and the Recent command.
Like some of the other views in Project, you can copy the table or use the Copy Report command. In this case, the difference is in what is actually copied. The Copy Report command will copy all elements (Charts, Tables, Images, etc.) in the report, while copy only copies what is selected in the report.
Figure 8.39 Copy Report command. This figure shows the Copy Report command used within a Standard Report. Unlike copying selected report elements individually, Copy Report copies the complete report, including charts, tables, and graphics, as a single object. Use this command to quickly transfer complete Microsoft Project reports into presentations, documents, or emails.
Copy the report and then paste it into slide five. There are two Paste options. When you have completed this last paste, the presentation is complete.
Save your presentation.
When Finished with Exercise 8.6
There are five pages in this Copy exercise. In the Status Presentation.pptx file, the last three slides appear like those in the figures above and the slides in the figure below.
(3)
Figure 8.40 Copy Picture of a Standard Report and Paste into PowerPoint. This figure shows a completed Microsoft PowerPoint presentation containing a Standard Report copied from Microsoft Project. The report retains its formatting, charts, and tables, making it suitable for executive presentations and stakeholder meetings. Use this workflow to build professional presentations directly from Microsoft Project reports without recreating graphics manually.
Exercise 8.7: Create Reports for Your Master Project (30 minutes)
In the Communication Network.docx file, you rank-ordered groups or individuals that require formal communication. You also defined the reporting they required. Select two groups or individuals requiring Microsoft Project reporting and then create those reports. When finished, print the reports as *.pdf files and name them Report1.pdf and Report2.pdf.
Eventually, you need to match each major stakeholder group in your Communication Network to the reports, views, dashboards, or presentation formats used to communicate project information.
When Finished with Exercise 8.7
You selected two groups from your Communication Network.docx file and created a report for each group. After finishing the reports, you printed them as pdf files and named them Report1.pdf and Report2.pdf.
(3)
Update Journal on Plan Project Communications (15 minutes)
Journal
Consider the needs and expectations of different stakeholders on the projects you will manage in the future.
Journal question:
"What types of reports do you think you will utilize in the future, and how will these reports contribute to transparency, decision-making, and project monitoring?”
Final Steps
Finalizing Activity 8 and Taking the Exam (1 hour 8 minutes)
In this last Application for Plan Project Communications:
Review Project Management and Microsoft Project Best Practices. Reflect on the fundamental principles of project management and the best practices associated with utilizing Microsoft Project as a project management tool.
Master Project Assessment. Ensure that your master project is current and a testament to your understanding of the intricacies of effective project initiation, planning, and execution.
File Review. Examine the list of files used throughout the application to consolidate your understanding of the tools and resources that have played a role in your project management journey.
Learning Objectives Evaluation. Reflect on the learning objectives set for this Activity, considering how well you've achieved each goal and identifying areas for further growth.
Activity Exam. Demonstrate your proficiency by tackling the Activity exam, which focuses on the key concepts and practical applications discussed in the MS Project Master Class Book and this Online Applications page.

Review Best Practices for Activity 8 (3 minutes)
Best practices in project management, including Microsoft Project, refer to a set of proven techniques, methods, or processes recognized as effective and efficient in achieving project objectives. These practices have evolved through the collective experiences of project managers and organizations across various industries. They are considered the most reliable and successful approach to managing projects and can be applied in different environments. When incorporating Microsoft Project into project management workflows, several specific best practices can further enhance project initiation, planning, execution, closing, and control.
Plan Project Communication Workflow
Group stakeholders, rank, and plan communication.
For each communication, list receivers, senders, information, schedule, and format.
Conduct a dry run to confirm that all stakeholders get the reporting they want and when they want it.
Standard Reports
Use the Organizer to manage reports.
Printing Views
If a view will be printed during each update cycle, create a new view just for printing so that it does not need to be re-formatted for each WYSIWYG print.
For Views that you print out routinely, create a custom view with all of the other custom elements associated with the view, such as tables and filters, and use those elements for just reporting. Consider naming the custom elements the same name as the report.
Page Setup for printing is saved with the view, so sharing opinions with other projects or users also shares that setup.

Review Microsoft Project Features Used in Activity 8 (20 minutes)
Standard Reports
Standard Reports in Microsoft Projects are a powerful feature that offers a wealth of pre-built, highly customizable options to suit various project management needs. These reports fall into several categories: Dashboards, which give a visual overview of the project's status; Resources, focusing on the allocation and utilization of resources; Costs, detailing financial metrics; In Progress, showing real-time task and activity progress; Getting Started, which are ideal for new users setting up projects; and Task Boards, supporting Agile methodologies with a visual representation of tasks. (However, as mentioned, the Getting Started reports are not reports, and building Agile methodologies into Microsoft Project is counterintuitive and contradictory.)
Each report is ready to use out of the box and offers extensive customization options. Users can modify data fields, adjust formats, and integrate formulas, empowering them to tailor the reports precisely to their project's unique requirements. This flexibility extends the utility of these reports, enabling dynamic updates that automatically reflect project changes, ensuring stakeholders always have the most current data at their disposal.
Moreover, these reports can be easily shared with team members and stakeholders, fostering collaboration and ensuring everyone is well-informed about the project's Progress and status. Reusing these reports in other projects, especially for similar or recurring projects, significantly saves time and effort in setting up new reports.
An additional helpful feature is that these reports can be treated like any other view in Microsoft Project. They can be displayed in a split window, allowing users to view a report in one pane while viewing a Gantt chart, calendar, or any other project view in another. This capability is invaluable for simultaneously analyzing different aspects of the project, such as comparing planned versus actual Progress.
Finally, these reports' robust export capabilities support exports to formats like PDF or Excel. This is especially beneficial for presenting project status in meetings or for further analysis outside of Microsoft Project, catering to stakeholders who might not have direct access to the software.
By incorporating these details, the chapter will provide readers with a thorough understanding of how to effectively leverage Standard Reports in Microsoft Project to monitor, manage, and communicate various aspects of their projects.
Figure 8.41 Standard Reports. This figure shows a completed Microsoft Project Standard Report displayed as a PDF, including summary tables and graphical charts that communicate project work, cost, and performance information. Use this type of report to provide stakeholders with professionally formatted project information that can be printed, archived, or distributed electronically.
Printing Views
Printing views in Microsoft Project are pivotal in sharing project information with stakeholders who may need direct access to the software. This functionality is a key tool for producing hard and digital copies of different project views, often essential for meetings, presentations, or archiving purposes.
Types of Printable Views
Microsoft Project offers a variety of views that can be printed, each serving different purposes depending on the information you want to convey. Commonly printed views include:
Gantt Chart: Perhaps the most frequently used view, this provides a visual timeline of the project schedule, showing task durations, dependencies, and progress.
Task Usage: This view shows how tasks are scheduled over time, including details about the work assigned to each task per day or week.
Resource Sheet: This sheet lists all the project's resources and details their availability and cost rates.
Network Diagram: Visualizes the project tasks in a flowchart-like diagram that illustrates task dependencies.
Printing Setup and Customization
To print a view in Microsoft Project, you first need to ensure that the view is set up to display the desired information effectively. You can customize the view by adjusting the timescale, formatting, and displayed data columns. Once the view is ready, you can access the print options to customize the printout further:
Page Setup: This dialog box allows you to adjust the paper size (like the standard 8.5 x 11 inches), orientation (portrait or landscape), and scaling options to fit your view onto the number of pages you prefer.
Print Preview: Before printing, you can use the Print Preview feature to see exactly how your document will look on paper. This tool is invaluable for making final adjustments to ensure the printout communicates the necessary information without clutter or truncation.
Header and Footer: You can customize headers and footers to include important information such as project title, date, page numbers, and any custom text that might help understand the printed material.
Practical Uses
Printed digital views from Microsoft Project are often used in status update meetings, project audits, stakeholder reviews, and archival documentation. They provide a snapshot of the project’s status at a particular time, which can be extremely useful for communication, especially in environments where digital access is limited or non-preferred.
By understanding and effectively utilizing Microsoft Project's printing capabilities, project managers can ensure that all stakeholders are informed and engaged with the most relevant and up-to-date project information.
Figure 8.42 Printing views. This figure illustrates the Print Preview window used to prepare a Microsoft Project view for printing or exporting to PDF. It shows page scaling, page selection, and print configuration options before generating the final output. Use this feature to verify layout, pagination, and formatting before distributing printed or electronic project views.
Visual Reports
Visual Reports in Microsoft Project offer a dynamic way to present project data through graphical representations, utilizing the robust analytical capabilities of familiar tools like Microsoft Excel and Microsoft Visio. These reports benefit stakeholders who need to digest complex project information quickly and clearly. Here's a detailed overview of Visual Reports in Microsoft Project:
Purpose and Benefits
Visual Reports are designed to transform raw project data into visually appealing and easy-to-understand charts and tables. They provide an immediate visual summary of the project's status, health, and overall progression. The key benefits include:
Enhanced Data Visualization: Project data can be represented graphically through charts and diagrams, making it easier for stakeholders to comprehend trends, patterns, and outliers.
Customizable Templates: Use pre-designed templates that can be customized in Excel or Visio, allowing for flexibility in how data is presented.
Interactive Elements: PivotTables and PivotCharts in Excel enable users to drill down into data, offering interactive capabilities that allow viewers to dynamically explore various aspects of the project data.
Types of Visual Reports
Microsoft Project includes several pre-built Visual Report templates categorized into three main groups:
Task Usage Reports: These reports focus on task allocation and performance over time, making them ideal for monitoring task progress and workload distribution.
Resource Usage Reports visualize how resources are utilized across the project, helping to identify overallocation or inefficiencies.
Assignment Reports: A detailed look at specific assignments shows the relationship between tasks and the resources assigned.
Each category includes templates for both Excel and Visio, depending on the preferred output format. Examples include the Cash Flow Report, Earned Value Over Time Report, and Resource Remaining Work Report.
Creating a Visual Report
To create a Visual Report in Microsoft Project, follow these steps:
Select the Report: Navigate to the 'Report' tab, choose 'Visual Reports', and select from the available Excel or Visio reports list.
Customize the Template: Once a template is selected, it can be customized further in Excel or Visio. For Excel, this might involve modifying PivotTables or PivotCharts. In Visio, you might adjust shapes, colors, and layout.
Filter and Field Selection: Adjust filters and field choices to refine the data displayed, focusing on specific resources, tasks, or time periods.
Export and Share: Once the report is finalized, it can be saved and shared as a standard Excel or Visio file, making it easy to distribute and present.
Tips for Effective Visual Reports
Simplify Information: Avoid clutter by only including essential data. Too many elements can make the report clearer and more impactful.
Use Appropriate Charts: Choose the chart types that best represent the data.
Consistent Style: To make your reports easier to read and more professionally appealing, use consistent colors, fonts, and layout throughout.
Regular Updates: The visual reports should regularly reflect the latest project data. This ensures that decision-making is based on the most current information.
Visual Reports are a powerful feature within Microsoft Project that extends the software's utility beyond printing views and standard reports. They provide comprehensive data analysis and reporting capabilities. By effectively using Visual Reports, project managers can ensure that complex data is accessible and understandable, enhancing communication and decision-making throughout the project lifecycle.
Figure 8.43 Visual Reports. This figure shows the Visual Reports command and the Visual Reports – Create Report dialog box used to export Microsoft Project data to Microsoft Excel or Visio. Use this feature to create PivotTables, PivotCharts, and other advanced analytical reports that extend beyond the capabilities of Standard Reports.
Screen Capture
Microsoft Project offers powerful features for exporting and sharing project information across other applications like Microsoft Word, Outlook, and PowerPoint. These features—Copy Selection, Copy Picture, Copy Timeline, and Copy Report—are designed to facilitate communication and presentation of project details. Here's a detailed overview of each function and how to use them to paste information into other Microsoft Office applications:
Copy Selection
Copy Selection allows users to copy specific data or text selections from a task, resource, or tabular data within Microsoft Project.
How to Use: Select the rows or cells in a table within Microsoft Project, right-click, and choose "Copy." You can paste this selection into Microsoft Word, Outlook, or PowerPoint using the standard paste options.
Applications: This is useful for sharing specific details about tasks or resources without needing the entire project view.
Copy Picture
Copy Picture lets you create a snapshot of the current view or selected part of your project schedule, which is helpful for reports and presentations.
How to use it: Go to the "Task" tab and click "Copy Picture." A dialog box will appear, allowing you to choose whether to save the picture as a GIF image file or for screen or printer use. You can also select the range of data to capture, either as shown on the screen or by specifying a date range.
Applications: The image can be pasted directly into documents or slides in Word, PowerPoint, or even in an email through Outlook, providing a visual snapshot of the project timeline or any specific aspect.
Copy Timeline
Copy Timeline is handy for sharing a high-level overview of the project timeline. It allows users to copy the timeline view directly.
How to Use: From the project timeline at the top of the Microsoft Project window, right-click and select "Copy Timeline," then choose "For Email" or "For Presentation" to adjust the level of detail. Then, paste this timeline into Word documents, PowerPoint presentations, or Outlook emails.
Applications: Ideal for including in project updates, proposals, or executive summaries where a concise, high-level view of the project schedule is necessary.
Copy Report
Copy Report involves copying graphical or tabular reports created within Microsoft Project.
How to Use: Navigate to the "Report" tab, select the desired report, and use the copy function to place it on the clipboard. From there, you can paste it directly into Word, PowerPoint, or an email in Outlook.
Applications: Useful for sharing detailed reports like resource allocation, progress updates, or financials in a format that is easy to read and ready for presentation.
Integrating with Microsoft Office Applications
After using any of these copy features, integrating the data into Word, Outlook, or PowerPoint is straightforward:
Word: Paste the copied content into a Word document to include in reports, plans, or documentation. Formatting can be adjusted in Word to fit the context of the document.
Outlook: Paste the content into an email to quickly share updates or data with stakeholders. This can be particularly effective for timely communication directly from your project workspace.
PowerPoint: For impactful presentations during stakeholder meetings or team updates, include pasted timelines, pictures of your Gantt chart, or reports in PowerPoint slides.
These features enhance Microsoft Project's versatility by making it easier to communicate complex project information in a visually appealing and accessible format across various platforms.
Figure 8.44 Copy Picture a view pasted into PowerPoint. This figure demonstrates a Gantt Chart copied from Microsoft Project using Copy Picture and pasted into a Microsoft PowerPoint presentation. The image preserves taskbars, formatting, and schedule details exactly as they appear in Microsoft Project. Use this workflow to communicate detailed schedule information during presentations and stakeholder meetings.

Ensure Your Master Project and Exercise Activity 8 Files are Up-To-Date (15 minutes)
You completed multiple exercises in these MS Project Online Applications and worked with several exercise files. Regarding your Master Project, you have completed the following:
In the Communication Network.docx file, you rank-ordered groups or individuals that require formal communication and defined the reporting they need.
You embedded the Communication Network.docx at the Project Summary level.
The Work and Cost Status report you created in Exercise 4 was shared with your Master Project.
You selected two groups from your Communication Network.docx file (Exercise 7) and created a report for each group. After finishing the reports, you printed them as PDF files and named them Report1.pdf and Report2.pdf.
When finished with exercises 1 - 7, you should have completed:
Exercise 8.1:
The communication plan for your Master Project should be defined in the Communication Network.docx. This file and the Master Project Reporting Cycle file should be embedded as an object at the project summary level.
Figure 8.45 Communication Network embedded at the project summary level. This figure shows the Communication Network document embedded as an object within the Project Summary task of a Microsoft Project Master Project. Use this approach to keep supporting documentation directly associated with the project file, making important planning information easily accessible throughout the project lifecycle.
Exercise 8.2
For the Work.mpp file should have entered these two sets of notes:
In the Project Summary task Notes, you have identified each field marked A—F taken from Figure 8.5 above, in the Task Usage view as shown in the figure below. For example, in Figure 8.5, B is next to a field that shows 88h on a Friday. What field is that and what does that data represent? These are the choices:
Task Work. This represents the total work on a task.
Task Timephased Work. This represents the work on this task on this day.
Project Work. This represents the total work on the project.
Project Timephased Work. This represents the total work on the project on this day.
Resource Work. This represents the total work for this resource.
Resource Timephased Work. This represents the work for this resource for this time period.
Assignment Work. This represents the assignment work.
Assignment Timephased Work. This represents the assignment work for this time period.
In the Assignment Information Notes field for the Project Manager on the Select Video Cast task that is available in the Resource Usage view shown in the second figure below, you have described what each Work field, A—D, marked in the figure above, tells you. For example, in Figure 8.6 above,D is next to a field that shows 8h on Friday. What is that field, and what does it represent?
Figure 8.46 Exercise 2 Part A results for Work.mpp. This figure shows the completed Exercise 2 results, including Project Summary task notes documenting the meaning of the various Work fields displayed in the Task Usage view. Use this exercise to verify your understanding of Project, Task, Resource, Assignment, and time-phased Work values used by the Calculation Engine.
Figure 8.47 Exercise 2 Part B results for Work.mpp. This figure illustrates the completed Assignment Information notes describing the Work fields associated with a specific resource assignment in the Resource Usage view. Use this exercise to reinforce the relationship between assignment data and time-phased work calculations performed by the Calculation Engine.
Exercise 8.3:
Your Printing.pdf file should look similar to the one below.
A - It is less than four pages.
B - Resource Name is sorted A - Z.
C - These fields are shown with the data, centered in the columns.
D - This date range is displayed.
E - These Details are included.
F - A similar color scheme is applied.
G - These fields and similar formatting and color schemes are in the header.
Figure 8.48 Exercise 3 printing to a PDF driver. This figure displays the completed printing exercise with page layout, sorting, formatting, date range, and detail settings applied before printing to a PDF driver. Use this example to verify that your printed project view matches the required formatting and presentation standards.
Exercise 8.4:
You created the Work and Cost Status report in the Standard Reports.mpp file.
The Work and Cost Status Report.pdf file should look similar to the one in the figure below.
The report should be on four pages.
Each chart and table is neatly positioned on each page.
Each chart and table has a text title.
The correct footer information is printed on each page.
Last, you shared this Work and Cost Status report with your Master Project.
Figure 8.49 Exercise 4 results printing a Standard Report as PDF. This figure presents the completed Work and Cost Status Report after being printed as a PDF. The report includes professionally formatted charts, tables, pagination, and footer information. Use this completed example to verify that your Standard Report is formatted correctly before sharing it with stakeholders.
Exercise 8.5:
Take a screen capture of the Excel template file like in the figure above. You can Press Ctrl + PrtScn keys or use a capture app.Name the file Visual Reports.jpg. Use any common extension like tiff or png.
Figure 8.50 Exercise 5 results for new Visual Reports template. This figure shows the completed Who Does What When Visual Report template appearing in the Visual Reports dialog after being successfully saved. Use this example to verify that your custom Visual Report template has been installed correctly and is available for future projects.
Exercise 8.6:
There are five pages in this Copy exercise. In the Status Presentation.pptx file, the last three slides appear like those in the slides in the figure below.
Figure 8.51 Exercise 6 results copy picture of Standard Report and paste into PowerPoint. This figure shows the completed PowerPoint presentation after copying a Standard Report from Microsoft Project. The report preserves charts, tables, and formatting, providing a professional presentation suitable for executives and project stakeholders. Use this workflow to quickly create presentation-ready status reports directly from Microsoft Project.


If you are working with a coach or plan to earn a certificate, use this file folder system to store your files.
Review List of All Completed Activity 8 Files (5 minutes)
The files used for these Master Class Online Applications are:
Your Master Project.mpp.
Communication Network.docx.
Master Project Reporting Cycle
Work.mpp
Printing.mpp
Printing.PDF
Standard Reports.mpp
Work and Cost Status Report.pdf
Visual Reports.jpg
Status Presentation.pptx
Report1.pdf
Report2.pdf
Your updated Journal
Completed evaluation of the learning objectives in Learning Objectives for Plan Project Communications.xlsx in the next section.
PDF of your exam results.

What to Do with Your Files
After you finish this Activity, remember to save your files and keep them organized.
If you are working with a Master Class Coach:
Put all the files listed above into your folder structure as suggested.
Zip these folders before your next session.
Email the zipped file to your Master Class Coach.
You don’t need to send your files to a Certified Master Class Reviewer to earn a certificate; your coach will review your work.
If you are NOT working with a Master Class Coach (Certificate Path):
Put all the files listed above into your folder structure.
Zip the files to archive them and keep everything organized.
When you’re ready, send all your Activity files together to a Certified Master Class Reviewer for evaluation.
Important
As you work through all Activities, you’re building a complete set of project files. Keep everything organized since you’ll need the full set for review.
Evaluate Activity 8 Learning Objectives (10 minutes)
Identify Communication Requirements: Can I identify the information requirements, reporting needs, communication frequency, and communication responsibilities for the stakeholders involved in a project?
Create a Communication Network: Can I organize stakeholders into meaningful groups and define the communication relationships needed to support project execution and decision-making?
Define a Reporting Cycle: Can I establish a reporting cycle that determines when project information will be collected, updated, reviewed, and communicated throughout the project life cycle?
Establish Reporting Standards: Can I determine the reports, views, dashboards, formats, and communication methods needed to communicate project information consistently and effectively?
Use Microsoft Project Reporting Features: Am I comfortable using Microsoft Project views, reports, dashboards, visual reports, and presentation tools to create and distribute project information?
Communicate Project Performance: Do I understand how to use information produced by the Calculation Engine to communicate schedule, workload, resource, cost, and project performance information?
Develop a Communication Plan for the Master Project: Can I apply the Activity 8 Workflow to create a practical communication plan that supports the needs of my Master Project stakeholders?
Support Project Decision-Making: Can I ensure that the right information reaches the right stakeholders at the right time to support effective project management and project control?

Before taking the following exam, click the Download icon above to open the Learning Objectives for Plan Project Communications.xlsx and complete this evaluation of the learning objectives.

Final Score
When you are finished, print your score and exam results as a PDF file if you are working with a Coach or plan to earn a certificate.
Take the Activity 8 Exam (15 minutes)
Complete this Activity by taking the exam. Take the exam by clicking on the Exams button below.
Here are some essential guidelines for taking the exam:
Approach the exam as a closed-book assessment, relying solely on your memory and grasp of the subject matter.
Always select the most appropriate answer.
Keep in mind that answers carry different weights.
Feel free to attempt the exam multiple times to refine your understanding.
To attain the MS Project 24 Hour Master Class Certificate of Completion, achieve a final score of 80% or higher.
Plan Project Communications FAQs
What is project reporting in Microsoft Project?
Project reporting means gathering, organizing, and sharing project information with stakeholders. This is done through reports, dashboards, views, tables, and visualizations created from the project schedule.
Why is project reporting important?
Project reporting provides stakeholders with a clear view of schedule performance, progress, milestones, resource utilization, risks, issues, and expected results. This helps them make informed decisions.
What is a project communications workflow?
A project communications workflow explains who needs project information, what they need, when they need it, and how it will be delivered during the project.
Who should receive project reports?
Project reports usually go to sponsors, project managers, team members, line managers, customers, executives, and other stakeholders, depending on what information they need and their roles in decision-making.
How often should project reports be produced?
How often reports are created depends on what stakeholders need and how complex the project is. Reports might be made daily, weekly, monthly, at milestone reviews, or during major project events.
What information should be included in a project status report?
A project status report usually covers schedule progress, milestone status, key activities, resource performance, risks, issues, budget details, and upcoming tasks.
What reporting tools are available in Microsoft Project?
Microsoft Project offers built-in reports, dashboards, visual reports, custom tables, filters, groups, views, timelines, and data export options for creating project reports.
What is a Visual Report in Microsoft Project?
A Visual Report exports project data from Microsoft Project into Excel or Visio for additional analysis and presentation. Visual Reports use PivotTables, PivotCharts, and OLAP technology to help analyze schedule, cost, resource, and project performance information. They are particularly useful when stakeholders require analytical reports beyond the standard reports available within Microsoft Project.
What is the difference between a project report and a project dashboard?
A report usually gives detailed project information. A dashboard, on the other hand, presents key project metrics and performance indicators visually for quick review.
Can Microsoft Project create executive-level reports?
Yes. Microsoft Project offers dashboard, milestone, and resource reports, as well as custom reporting features that can be tailored for executive audiences.
What reports should a project manager create in Microsoft Project?
The reports created should reflect the needs of the project's stakeholders. Common reports include Project Overview reports, Milestone reports, Resource reports, Cost reports, Burndown reports, Dashboard reports, and Schedule Status reports. The best reports communicate the information stakeholders need to make decisions and manage the project effectively.
What information should be included in a project status report?
A project status report typically includes progress against major deliverables, milestone status, schedule performance, resource utilization, cost performance, key accomplishments, upcoming activities, major issues, risks, and corrective actions. The exact content should be tailored to the needs of the stakeholders receiving the report.
What is a reporting cycle?
A reporting cycle is the planned schedule for creating, reviewing, sharing, and using project reports during the project.
What is a reporting cycle in Microsoft Project?
A reporting cycle is the recurring process for collecting project updates, updating the project schedule, recalculating project information, and distributing reports to stakeholders. A typical reporting cycle includes collecting progress information from team members, updating the project against a Status Date, allowing the Calculation Engine to recalculate project information, and then distributing reports for review and decision-making.
What is the Status Date in Microsoft Project?
The Status Date is the date used to evaluate project progress and performance. It represents the point in time at which project updates have been collected and entered into the project. Microsoft Project uses the Status Date for many progress, variance, and earned value calculations. If no Status Date is specified, Microsoft Project uses the Current Date.
How do project stakeholders determine which reports they need?
Stakeholders decide what reports they need based on their roles, authority, the decisions they make, and the information needed to manage the project.
What is the difference between project monitoring and project reporting?
Project monitoring means collecting and analyzing project data. Project reporting is about sharing that information with stakeholders in a useful way.
How does project reporting support project control?
Project reporting helps spot schedule changes, delays, resource issues, risks, and performance trends. This way, corrective actions can be taken before problems get worse.
What reports are most commonly used in Microsoft Project?
Common reports are project overview, milestone, critical path, resource, cost, work, and status reports.
What is the difference between a view and a report in Microsoft Project?
A view is a way of displaying project information for interactive use within Microsoft Project. Examples include the Gantt Chart, Resource Sheet, and Task Usage views. A report is a formatted presentation of project information designed for communication and decision-making. Reports often summarize information from multiple views and can be printed, shared, or presented to stakeholders.
How does Microsoft Project support stakeholder communications?
Microsoft Project helps with stakeholder communication by offering customizable reports, dashboards, timelines, printable reports, and exported data that can be shared across the organization.
Suggestions and Corrections
Please help us make this MS Project Master Class Book and the Master Class Online Applications better. Click on the Comments button below to send us suggestions and corrections.