

Last Updated: June 25, 2026
Activity 7: Determine Schedule Logic in Microsoft Project
Earlier, you worked out the duration, work, cost, and resource estimates for the activities in your Work Breakdown Structure. Now your project has the details needed to build a schedule, but it still needs one important thing: schedule logic.
In this Activity, you will learn how to connect activities and milestones so that Microsoft Project can determine when work should start and finish. You will look at Task Modes, Timing Constraints, Deadlines, Dependencies, Cross-Project Links, and the Critical Path Method (CPM). These ideas form the scheduling logic that enables Microsoft Project to create and update a dynamic project schedule.
Microsoft Project calculates schedules based on the logic you enter. If activities are not linked properly, if timing constraints are set incorrectly, or if important relationships are missing, the software will still give you dates. However, the results may not match how the project will actually run.
In the next exercises, you will learn how to set timing constraints, choose the right Task Mode, create links between activities and milestones, and analyze the Critical Path. You will also work with Network Diagrams and try techniques such as schedule compression, fast-tracking, and crashing. In addition, you will look at cross-project dependencies and Master Projects, where scheduling logic extends beyond a single project file.
By the end of this Activity, your Master Project will be more than just a list of activities with estimates. It will become a connected project model that can calculate timelines, spot schedule risks, and help you control the project. At this stage, your project will start to function like a real schedule rather than just a list of elements.
The Work Breakdown Structure defines what work exists. Estimates define how much work is required. Schedule Logic defines when and in what sequence the work will occur.
New to the MS Project Master Class?
If you found this page through a search engine or external link, use the Start Here button below to learn about the Free and Complete MS Project Master Classes, the Learning Portal, Project MAP framework, Activity Workspaces, exercises, and the Master Project.
Figure 7.1 Determine Schedule Logic in Project MAP.
Activity 7 Workspace Outline
Activity 6: Enter Estimates < Activity 7: Determine Schedule Logic > Activity 8: Plan Communications
Workflow (25 minutes)
Exercises (3 hours 55 minutes) jump to
Exercise 1: Define Timing Constraints (20 minutes) jump to
Exercise 2: Select Task Mode (10 minutes) jump to
Exercise 3: Select Task Mode and Timing Constraints for Your Master Project (30 minutes) jump to
Exercise 4: Review Calculation Engine (15 minutes) jump to
Exercise 5: Link Activities and Milestones (10 minutes) jump to
Exercise 6: Link Activities and Milestones in Your Master Project (30 minutes) jump to
Exercise 7: Analyze Critical Path (20 minutes) jump to
Exercise 8: Format Network Diagram (40 minutes) jump to
Exercise 9: Analyze The 4 Hour House (40 minutes) jump to
Update Journal on The 4 Hour House and Determine Schedule Logic (20 minutes) jump to

This entire Activity Workspace should take 5 hours and 23 minutes to complete.
This Activity Workspace is part of the MS Project Master Class learning system and the companion Master Class Book available on Amazon. Many students also complete the Master Class with the assistance of a Master Class Coach or Trainer.

Figure 2.2 Workspace schedule.
The schedule logic, dependency management, and critical path methods and best practices shared in this Activity Workspace come from over 35 years of experience teaching Microsoft Project, training consultants, deploying Project Server, and helping professionals around the world.
Workflow
Internalizing the Activity 7 Workflow (25 minutes)
Overview and What You Will Learn
Before you start the exercises in this Activity Workspace, take a moment to review the Activity 7 Workflow. This workflow provides a clear guide to scheduling logic and outlines the steps, decisions, and Microsoft Project tools you'll use to turn a list of activities into a working project schedule.
Like in earlier activities, your main goal is to understand and absorb the workflow, not just finish the exercises. Experienced project managers do many of these steps naturally. They see task modes, timing constraints, dependencies, deadlines, and critical path relationships as parts of one scheduling process, not as separate software tools.
In this activity, you'll see how Microsoft Project's Calculation Engine sets the timing of work based on the logic you create. You'll look at the differences between Manually Scheduled and Automatically Scheduled WBS elements, learn when and how to use timing constraints and deadlines, set up predecessor and successor relationships, and explore the types of dependencies that shape how activities and milestones connect.
You'll also learn how the Critical Path Method (CPM) determines project duration, identifies where the schedule is flexible (float and slack), and highlights which activities directly affect the project's finish date. Finally, you'll look at ways to shorten the schedule, manage cross-project dependencies, and work with Master Projects, where the schedule logic extends beyond a single project file.
As you go through the exercises, keep checking the workflow. By the end of this activity, you should be able to see how schedule logic is built, managed, and reviewed in Microsoft Project. Most importantly, you should start to see project schedules the way experienced project managers do: as connected systems of work, not just lists of tasks.
Learn Determine Schedule Logic Workflow (10 minutes)
Navigating Project Seas: Setting the Course with Task Mode, Activities, and Milestones

As navigators of project seas, captains—or project managers—must choose their course carefully when plotting the journey, whether it's a significant summary element, an activity, or a pivotal milestone. Microsoft Project is like a ship's compass, offering two navigational methods: manually scheduled, which is like charting one's path by the stars or the way project managers drew timelines before software, and Automatically Scheduled, which is like setting the autopilot based on the ship's advanced instruments.
Manually Scheduled: This is for captains who trust their sea intuition and wish to steer the ship based on personal experience or conditions the compass doesn't recognize. Such freedom allows a captain to adjust the sails as they see fit, but it might raise the crew's eyebrows—they could question whether traditional navigation standards are being upheld.
Everyone would question why they were the captain of a modern sailboat with sophisticated instrumentation.
Automatically Scheduled: This mode is for those who prefer to calculate the course using the compass. It considers ocean currents (dependencies), trade winds (calendars), the position of the sun and moon (timing constraints), and the size of the crew (resource assignments). It guarantees that the ship follows a path determined by established maritime logic.
A sage captain ponders: What should dictate the course for each WBS element? Choosing wisely lays the groundwork for a journey either strictly by the nautical charts or more adaptable to the sea's whims.
Even as the wind's direction is set, deadlines, much like ports of call, are scheduled for both manually and automatically plotted courses. The ship's log – Microsoft Project – keeps a meticulous record, indicating whether the vessel is sailing on schedule to reach these ports. Without the deadlines feature, a captain with a keen eye can still navigate effectively. One must consider: What destinations are crucial, and how will they influence the voyage?
Furthermore, timing constraints are the maritime laws and port regulations that can impact a ship's departure or arrival. Questions every captain must address: Does this activity or milestone face any seasonal tides or harbor deadlines that must be factored in?
Charting the Course: Sequence Activities and Milestones

Sequencing is like charting a sailing trip, where the sequence of each leg, from one milestone to the next, must be carefully plotted. Microsoft Project offers four main navigational routes: Finish to Start (FS), Start to Start (SS), Finish to Finish (FF), and Start to Finish (SF). Each represents a different way to sail from one point to another.
Like the tide's ebb and flow, each route can include lead or lag time, allowing for periods of swift passage or necessary doldrums. A captain must always ask: How do the currents flow between these points, and how do they affect our journey?
Observing the Horizon: Review Timeline and Critical Path

The voyage timeline is the map outlining the entire journey's duration, showing when to expect the sighting of landmarks and arrival at milestones. At the heart of this nautical chart is the critical path, calculated by the stars using the Critical Path Method (CPM). This path, marked by the longest chain of dependent legs, dictates the earliest the ship can return to its home port. For those legs where time is as precious as the North Star, any deviation might mean missing the tide and delaying the entire journey.
The seasoned captain keenly examines this chart and the stars – the timeline and critical path. The crucial question is: Which are the non-negotiable legs of the journey, and how can we ensure they are navigated on time?
Charting the project's course in Microsoft Project is a vital undertaking. Through careful consideration and an astute choice of task modes, timely application of deadlines and constraints, strategic sequencing of activities, and vigilant monitoring of the critical path, the captain can master the art of navigation. Such meticulous planning ensures the ship stays true to its course, braving the vast project seas to reach its scheduled destination.

Activity 7: Determine Schedule Logic Workflow Chart
overview
Figure 7.2 Determine Schedule Logic Workflow.

Download
Click the Download icon above to open the Determine Schedule Logic Workflow.pdf file.

Update Journal on Determine Schedule Logic Workflow - 15 minutes
Reflect on a complex project scenario where you must balance flexibility with the rigor of strict deadlines and constraints.
Journal Question: “How would you utilize the features of Microsoft Project, such as selecting the appropriate Task Mode, selecting timing constraints and deadlines, sequencing activities, and managing the critical path, to ensure successful project delivery?”
Discuss how your choices in using these tools align with your project management philosophy and the ethical considerations you might face.
Exercises
Completing the Exercises for Activity 7 (3 hours, 55 minutes)
This series of exercises focuses on determining the scheduling logic of a project plan. In this series, you will:
Define Timing Constraints: A direct relationship exists between timing or scheduling constraints and the creation of links or a network.
Select the Appropriate Task Mode: Selecting Task Mode, where WBS elements are manually vs. automatically scheduled, is a feature that can not be ignored.
Review the Calculation Engine: This exercise reviews the Calculation Engine rules and the subsequent impact of each feature’s rules on the schedule. The software’s features have specific rules that must be understood to understand how WBS elements are scheduled. In addition, if needed, some features may or may not be based on project management thinking; they are just software features.
Link Activities and Milestones: In this exercise, you will look at the various ways to set and edit links or dependencies.
Analyze Critical Path: This exercise is designed to give you a good understanding of CPM calculations.
Format the Network Diagram: One of the primary views in Microsoft Project is the network diagram. In this exercise, you will either format an existing template or create a new one, then import it into a new network diagram view. In addition, we will look at the fields used for the Critical Path Method in a Gantt Chart view.
Compressing Project Duration, Fast-Tracking, and Crashing: The last exercise reviews techniques for decreasing schedule duration.
In addition, this application will review several Microsoft Project features and characteristics defined below.

Definitions
Task Mode: In Microsoft Project, "Task Mode" is the setting that determines how a WBS element is scheduled within a project's timeline. There are two types of element modes:
Manually Scheduled: When a WBS element is set to Manually Scheduled mode, the project manager has complete manual control over setting its start and end dates. In this mode, Microsoft Project does not automatically adjust the WBS element's dates based on changes in the project schedule or dependencies with other elements. This mode provides flexibility and is helpful in the early stages of project planning when details are still being determined. However, it requires careful management as it only utilizes some of Microsoft Project's full scheduling capabilities.
Automatically Scheduled: In Automatically Scheduled mode, Microsoft Project uses its built-in calculation engine to determine a WBS element's start and end dates based on various factors. These include project calendar settings, dependencies, constraints, and resource availability. This mode allows Microsoft Project to dynamically update the WBS element’s schedule when changes occur elsewhere, ensuring that the overall project plan remains coherent and aligned with set constraints and dependencies.
Choosing between these two element modes depends on the level of detail available and the degree of control or flexibility the project manager desires in scheduling WBS elements. While Manually Scheduled elements offer more control, they defeat the purpose of project management software and raise ethical concerns if a project is presented to stakeholders at any time during initiation and planning. Automatically Scheduled elements leverage the power of Microsoft Project's scheduling algorithms for efficiency and accuracy in project planning and execution.
Timing Constraints: In Microsoft Project, "Timing Constraints" refer to specific conditions or restrictions set on start or finish dates within a project schedule. These constraints manage when an element should or must begin or end, offering a way to incorporate real-world project requirements and limitations into the project plan. Here are the key types of timing constraints in Microsoft Project:
As Soon As Possible (ASAP): This is the default constraint for elements in a forward-planned project. It schedules elements to start as early as possible, considering dependencies and resource availability, without a start date.
As Late As Possible (ALAP): This is the default constraint for elements in a backward-planned project. It schedules elements to start as late as possible without delaying the project's end date.
Must Start On (MSO): This constraint sets a specific start date for an element. The element must begin on this date.
Must Finish On (MFO): This constraint sets a specific finish date for an element, which must be completed on that date.
Start No Earlier Than (SNET): This constraint sets an element’s earliest start date. The element will start after this date, but it can start later.
Finish No Earlier Than (FNET): This constraint specifies an element's earliest completion date. The element will be finished after this date, but can be completed later.
Start No Later Than (SNLT): This constraint sets an element's latest date. The element must start on or before this date.
Finish No Later Than (FNLT): This constraint determines a WBS element's latest completion date. The element must be finished on or before this date.
Timing constraints in Microsoft Project are vital for ensuring that elements align with specific project requirements, deadlines, or external dependencies. They allow project managers to tailor the project schedule to meet unique needs while utilizing the software's scheduling capabilities. However, using these constraints judiciously is essential, as over-constraining elements can reduce scheduling flexibility and lead to a more complex and difficult-to-manage project plan.
Deadlines: In Microsoft Project, a deadline is a specific date that indicates when an element should be completed. It serves as a target for the element's completion, but unlike a constraint, it doesn't directly affect how the element is scheduled. Deadlines are used to track the progress of elements against important dates without forcing them to start or finish on those dates.
Here's how deadlines work in Microsoft Project:
Setting a Deadline: You can set a deadline on an element by entering a date in the element's "Deadline" field. When a deadline is set, a small green arrow will appear on the Gantt chart on the specified date as a visual reminder.
Tracking and Alerts: Deadlines help monitor element progress. Microsoft Project displays a warning as an icon or message if an element misses its deadline. This allows project managers to identify delays early and adjust the schedule accordingly.
Flexibility: Deadlines are less rigid than constraints. While constraints dictate when an element can or must start or finish, deadlines provide a target date without influencing the element's actual scheduling. This allows for more flexibility in planning and adjusting elements while keeping an eye on critical dates.
Comparison with Due Dates: It's important to distinguish between deadlines and element due dates (end dates). The element's start date, duration, constraints, and dependencies determine the end date. A deadline, on the other hand, is a separate date that represents a goal or target for the element's completion, and it's independent of the element's scheduled start or end dates.
Deadlines in Microsoft Project are particularly useful for keeping projects on track toward critical milestones or deliverables without the strict restrictions that come with element constraints. They offer a balance between maintaining a schedule and allowing for adjustments as the project progresses.
Linking: In Microsoft Project, "linking" refers to creating dependencies between elements and establishing a relationship that dictates how these elements should be performed. Linking is a fundamental aspect of project scheduling, used to coordinate the flow of activities and ensure that elements are completed logically.
Microsoft Project supports various types of dependency links, including:
Finish-to-Start (FS): The most common type, where an element can only start after another element has finished.
Start-to-Start (SS): An element can only start when another element starts.
Finish-to-Finish (FF): An element can only be finished when another element finishes.
Start-to-Finish (SF): An element can only be finished when another element starts, and it is less commonly used.
Once elements are linked, Microsoft Project calculates start and end dates for all elements using these dependencies and other factors, such as element duration, constraints, and resource availability. Changes in one element can affect the linked elements, helping project managers see the impact of schedule changes across the project.
Linking elements is essential for managing a project's overall flow. It helps identify which elements must be completed before others begin, allowing for effective planning and execution.
Critical Path Method: The Critical Path Method (CPM) in Microsoft Project is a crucial project management technique used to determine the longest path of planned elements necessary to complete a project. By identifying this path, CPM helps calculate the longest route, selecting the earliest the project can finish. Here's a breakdown of how this method works in Microsoft Project:
Task Sequencing: The first step in using CPM is to break down the project into individual elements and then sequence them based on their dependencies. This involves establishing relationships between functions, such as Finish-to-Start (FS), Start-to-Start (SS), Finish-to-Finish (FF), and Start-to-Finish (SF).
Duration Estimation: Each element is assigned a duration estimate. Microsoft Project calculates the total project duration based on these individual element durations and interdependencies.
Identifying the Critical Path: Microsoft Project then identifies the critical path, which is the longest path through the element network. This path dictates the project's minimum completion time because it comprises elements that, if delayed, would delay the entire project.
Analyzing Task Slack: The software also calculates the slack (or float) for each element when an element can be delayed without affecting the project's end date. Elements on the critical path have zero slack, meaning any delay in these elements directly impacts the project's completion date.
Dynamic Updating: As the project progresses and elements are updated (e.g., changes in duration, completed elements, delays), Microsoft Project recalculates the critical path. This provides an ongoing, dynamic view of the project's most sensitive time frame.
Resource and Schedule Management: Understanding the critical path allows project managers to prioritize resources and adjust schedules to ensure that necessary elements are completed on time. It focuses on managing the most crucial aspects of the project schedule.
The Critical Path Method in Microsoft Project is an essential tool for understanding and managing the timeline of a project. It enables project managers to identify the elements crucial for the project's timely completion and to focus their management efforts where they are most needed. Microsoft Project provides a dynamic and responsive approach to project time management by continually updating the critical path as the project evolves.
Critical: It is important to note that Microsoft Project calculates CPM and marks those elements as critical. However, Microsoft Project also marks elements as critical if they have other scheduling restrictions. These are the conditions that mark elements as Critical.
Total Slack: Total Slack is zero or meets the critical criteria specified in Project Options. The selection is shown in the following figure.
Timing Constraints: All Timing Constraints can potentially mark an element as critical. These are those conditions:
It has a Must Start On (MSO) or Must Finish On (MFO) date constraint.
It has an As Late As Possible (ALAP) constraint in a project scheduled from a start date.
It has an As Soon As Possible (ASAP) constraint in a project scheduled from a finish date.
It has a Start No Later Than (SNLT) constraint, and the start date is the same or later than the constraint date.
It has a Finish No Later Than (FNLT) constraint, and the finish date is the same or later than the constraint date.
Deadline: If an element has a deadline date, and the current finish is the same as or beyond its deadline date.
% Complete: If an element is finished, it is no longer marked as critical.
Tip
You won’t likely plan a business trip in Microsoft Project, but you might plan that big European trip you're going on next summer. Consider using Microsoft Project for various personal projects, such as trips, events like weddings, kitchen remodels, residential moves, or preparing for the PMP exam. Using Project on multiple projects is one of the best ways to learn the software.
Download
To follow along with the figures related to what is critical in Microsoft Project, click on the Download icon above to open the What is Critical.mpp file.
Before starting the first exercise, let’s review what is critical in Microsoft Project.
The obvious is that any element on the critical path is critical. In the figure below, you can define what element qualifies for the critical path in Project Options.
Figure 7.3 Defining Total Slack in Project Options.
The What is Critical.mpp file shows zero Total Slack as Critical in the figure below. Task backgrounds are highlighted (the Critical highlight does not include Critical Milestones), and the Critical taskbars are red.
The only tasks identified as Critical in this What is Critical.mpp file are on the critical path.
Figure 7.4 Zero Total Slack marks an element as Critical.
However, in Microsoft Project, other elements can be classified as Critical when they meet criteria other than having a specified amount of Total Slack.
For example, In the same project shown, the duration of Task 1 was changed from 3 days to 5 days, pushing out everything on the critical path.
A - However, that duration change pushed out Task 10, 1 day past the Deadline date, so it is now critical with -1day of Total Slack, or what is now called Negative Slack.
B - Task 3 and Task 4 have MSO and MFO timing constraints, which marks them as critical.
C - Task 5 has an ALAP timing constraint in a project that is scheduled from the start date.
D - Task 6 has a Start No Later Than date, on or later than the current date.
In Microsoft Project, all of these tasks, not just those on the critical path, are marked as critical.

Note
It is important to pause for a moment and let this sink in. Currently, almost everyone understands the basics of the critical path method and why an element might or might not be on the critical path. However, as noted above, Microsoft Project broadens the idea of Critical. In Microsoft Project, there is a critical path, but Critical also includes activities and milestones that have timing constraints like Must Finish on a date (B), or have slipped past a Deadline date (A).
In the figure, the elementbars illustrate that elements A, B, D, and C are marked and highlighted as critical but are not necessarily on a critical path. For example, C has no predecessor, but because it has an ALAP timing constraint, it is pushed up against the critical path, making it Critical. Technically, it is not on the critical path, but practically, by the nature of the timing constraint, it becomes a Critical element from a schedule perspective.
Figure 7.5 Elements not on the critical path but marked as Critical.
Timing Constraints relate to this critical idea in Microsoft Project as much as elements on the critical path.
In addition, the timing constraint of an element likely impacts the types of links you make; a general best practice is to determine timing constraints before linking.
Watch the video below on Timing Constraints (3:32 minutes). It illustrates how timing constraints drive the schedule and the types of links you use by using the example of scheduling a personal tax return. (Not that you would ever do that; this is just an example.)
The video is sped up a bit to save viewing time.
An illustration of defining timing constraints in Microsoft Project and how those constraints drive the type of links you set.

Exercise 1: Define Timing Constraints (20 minutes)
This first exercise will review Timing Constraints with an exercise file.

Best Practice
Most activities, milestones, and summary elements should be ASAP or ALAP when executing a schedule. During execution, activity and milestone dates often become more fixed in time.
Because of the relationship between Timing Constraints and scheduling, selecting your Timing Constraints before linking activities and milestones is generally a best practice. A Timing Constraint can determine the types of links you make.
Download
Click the Download icon above to open the Travel.mpp file.
When you open the Travel.mpp file, Zoom Entire Project. This command is on the Bridge Quick Access Toolbar.
This plan, let’s say, is for your next business trip.
In the Travel.mpp file, you can insert a rudimentary drawing in the elementbar area of a Gantt Chart view. Limited formatting options are available, and a drawing can be attached to an element.
Figure 7.6 To add a drawing to the Gantt Chart view, Go to the Format tab / Drawing command on the ribbon.
In this project, first change the formatting to show this date format: 1/28/09 12:33 p.m. There are two ways to do this. One way is to change the date format in Options in the General category under Project view. If you changed the date format here, would this be in a local or global setting? Is the change applied only to this project or to all open projects?
Another way to change the format for just this project is to change the date format of the active table. Making this change is just for the table that is applied to the view currently active in the project; it does not make the change for any other project, table, or view that is open or applied.
To make the date change for just the table, on the ribbon, select the View / Tables command in the Data group, notice the Entry table is checked, More Tables… / Edit, and then make the selection in the Date format field.
In this plan, the Timing Constraint selected for the Flight Departs task is Must Start On because, for all practical reasons, even though a flight can be delayed and even legally leave a few minutes early, the departure time is non-negotiable. As travelers, we view the boarding and departure times as fixed in time and do whatever we need to do to be at the gate on time. During planning, this task could be treated as ASAP or ALAP based on a person’s scheduling preferences, but it is now fixed once the flight is purchased.
You are currently scheduled to depart on 6/17 at 4 p.m. Before you head to the airport, you have to do a few things, like take the dogs to the pet resort and pack. It typically takes about 90 minutes to get to the airport, pass security, and then go to your gate. Notice there is a 30-minute dependency lag because you like to get to the gate with about 30 minutes to spare or just before boarding starts.
All other tasks are scheduled as late as possible (ALAP), and Microsoft Project pushes them toward dependencies or links, preventing them from moving up to the finish date.
Why are all of those tasks scheduled for ALAP? You don’t want to go to the airport now or tomorrow; you want to go two hours before departure.
And…. because you want Microsoft Project to automatically schedule some tasks based on any changes you might make.
Figure 7.7 Must Start On Timing Constraint.
Let’s say a few days before your departure, your customer calls and tells you they are out with a bad cold and need to reschedule for Monday, July 5. Rebook your flight to Sunday, July 4, at 4:20 PM so you can be on-site on Monday, the 5th.
Make that change in the Constraint Date field for the Flight Departs task and notice what happens. First, the schedule shifts toward that date because the tasks are ALAP. That is a good thing; it is one of the main reasons people use a project management tool like Microsoft Project: They want the schedule to shift automatically based on changes. But in this case, the schedule isn’t calculated correctly because you are trying to schedule on a Sunday, a non-working day in the project calendar.
There are several ways to make Sunday a workday. Perhaps you will decide that the best and easiest way to remedy this problem for this project is to make an exception for July 4 in the project calendar.
To make this exception, go to the Project tab / Change Working Time command on the ribbon, scroll through the calendar, and select the date July 4. In the Name field below, type in Travel Day and press enter. Select the detail again and click on the Details button to edit. Then select the Working times: radio button and click OK to accept the default values. Click OK again, and July 4. July 4 is a working day; your travel day is now scheduled correctly.
To change the message in your graphic, click on the cell and edit.
Figure 7.8 Working day exception to the project calendar.

Case Notes

Timing Constraits: When "As Late As Possible" Is Too Early
During the years when I conducted Project Server deployments, every implementation included training. Project managers, team members, resource managers, and executives all needed to learn the new system before it went live. Because training typically occurs near the end of a deployment, it was almost always scheduled using an As Late As Possible (ALAP) approach.
On paper, this made perfect sense. The software would be installed, configured, tested, and ready to use. Then, just before go-live, everyone would be trained. If the deployment date slipped, the training could simply slip with it.
However, there is an important lesson hidden in that logic.
Training is not a simple activity. It requires instructors, classrooms, equipment, travel arrangements, and often dozens or hundreds of participants. At some point, the training schedule stops being flexible. Rooms are reserved. Instructors are booked. Participants receive invitations. What started as an ALAP activity gradually becomes a Must Finish On activity with very little room for movement.
I learned this lesson while working with the Defense Logistics Agency (DLA), the organization responsible for supplying the U.S. military with fuel, repair parts, weapons systems support, and countless other materials.
I was hired to train project managers on one of the first project management software packages available for personal computers. The classes went well, but there was one problem: the DLA did not yet have the software. A procurement delay prevented delivery, and the software did not arrive for another six months.
By then, most of what had been learned in training had been forgotten.
We conducted the classes again.
The issue was not the quality of the training. The issue was the schedule logic. Training had been scheduled against an expected delivery date rather than the actual delivery of the software. The activity should have been tied to a tangible predecessor—receiving the software—and scheduled as late as possible after that milestone was achieved.
This is one of the dangers of ALAP planning. It can be very effective when tied to something real and measurable. When tied to an assumption, however, it can create unnecessary risk and rework.
The DLA was anything but careless. In fact, one of the things I remember most about working there was the organization's commitment to procedures and rules.
On my first morning, I arrived before 6:00 a.m. for a 7:00 a.m. class. It was dark, raining, and the facility was nearly empty. I parked across from the gatehouse, stepped out of my car, and walked directly across a narrow road to obtain my visitor pass. As soon as I entered the gatehouse, the guard looked up and said, "The next time you fail to use the crosswalk, you will be ticketed."
I assured him I would be more careful.
A short time later, while navigating through a maze of warehouses looking for the training location, I stopped at what I was absolutely convinced was a flashing red light before making a left turn. Moments later, flashing police lights appeared behind me. I was issued a traffic citation for running a red light.
At lunch, I was instructed to visit the police office and pay the ticket immediately.
When I arrived at the counter, I jokingly announced to the woman on the other side, "I'm here to pay a traffic ticket. The last thing I want is to end up in DLA jail."
Without missing a beat, the young woman behind the counter smiled and replied, "Oh, you won't, Mr. Coker, as long as you follow the rules—like staying in the crosswalk and stopping at red lights."
I laughed, paid the ticket, and went back to teaching.
Looking back, the lesson applies just as well to Microsoft Project.
The software has rules. Some of those rules may seem inconvenient. Others may appear overly restrictive. But the purpose of those rules is the same as the purpose of procedures at the DLA: to create predictable, reliable results.
When you ignore schedule logic, misuse constraints, or create dependencies based on assumptions rather than reality, problems eventually appear. When you follow the rules and apply sound project management practices, Microsoft Project becomes a remarkably powerful tool.
Like most systems, it works best when you respect the logic that makes it work.
ASAP Timing Constraints always push towards the Schedule Start Date as selected or entered in Project Information.
However, the software has a scheduling feature that allows you to schedule new tasks against the current date. This feature is helpful on long projects, where the scope has changed months after the project started, and you are changing a section of your schedule.
(By default, new tasks are scheduled at the Project Start Date if you schedule from the Project Start. If you schedule from the Project Finish Date, a new task is scheduled against the Finish Date.)
You can schedule a new task against the Current Date, by going to File / Options / Schedule / Scheduling options for this project: / Auto scheduled tasks scheduled on: / select Current Date.

Warning
If you insert a new WBS element against the Current Date rather than against the Project Start or Finish, the software places a Timing Constraint that the task must Start No Earlier Than that current date.
The Current Date is based on the system clock by default, however, you can temporarily choose any date you want by changing the Current Date in Project Information.
Do the following:
Schedule new tasks against the Current Date. Note that this is a local setting.
Change the Current Date in Project Information to 7/4/21.
Enter a new task, give it 2 hours duration and notice that it is scheduled with a semi-fixed Timing Constraint of Start No Earlier Than the Current Date you just entered as the temporary Current Date. As the Current Date changes, that Timing Constraint will stay the same.
Save your project.
When Finished with Exercise 1
The Travel.mpp should look similar to the one in the following figure. The Flight Departs Must Start On date should be 7/4/21 at 3:20 PM; the green note in the Gantt Chart should also show that. The A New Task should have an SNET constraint of 7/4/21.
(4)
Figure 7.9 Define Timing Constraints exercise results.
Best Practice
In general, except for entries in the Notes field or custom fields, don’t make any changes to summary elements or what Microsoft Project calls summary tasks. Instead, allow summary elements to reflect what is indented below them rather than attempting to interact with indented summary elements, activities, and milestones. This best practice will make it easier to work with and interpret schedule changes.
Only link activities and milestones.
Do not apply timing constraints to summary elements.
Exercise 2: Select Task Mode (10 minutes)
This next exercise will review the Task Mode feature in Microsoft Project. Although I argue that all phases, summary elements, activities, and milestones should have the auto schedule Task Mode selected, this prominent feature of the software must be addressed.
Download
Click the Download icon above to download the Task Mode 2.mpp file.
After you open Task Mode 2.mpp, note the following:
The Task Mode for row zero, or what is also called the Project Summary Task, is Auto Scheduled. This can not be changed; it is always Auto Scheduled.
Summary 1 and Tasks 1, 2, and 3 are Manually Scheduled Tasks. If you use Manually Scheduled during the early rounds of estimating, notice that you can type in any text in the duration, start, and finish fields. The task responds to those entries if you type in an actual duration or date.
If you change Summary 1 to Auto Scheduled, what happens? In Auto mode, it calculates what it can. It moves to the first date in time. The rollup on the summary level, the period of the tasks indented below, is now five working days.
Figure 7.10 Auto Scheduled summary task with Manually Scheduled tasks.
Change Summary 1 back to Manually Scheduled. Change the Mode by clicking the Undo on the toolbar. Then click the Redo button and notice the behavior. Then, manually select Manually Schedule for Summary 1. The software keeps the last information calculated under Auto mode and puts it back to operating in manual Mode. The thing to remember when switching between Modes is that Microsoft Project considers the current data set and attempts to apply the Mode as well as it can.
Please change Task 2's duration to 10 days. The rollup on the summary level is not calculated because it is manually scheduled.
Link Task 2 and 3 in a standard dependency. Dates are now calculated for Task 3. Manually Scheduled tasks do follow some rules if you want them to. In this case, a selection in Options is selected to adjust the dates for Manually Scheduled tasks when editing links. This selection in Options is shown in the figure below.
Figure 7.11 Update Manually Scheduled tasks when editing links.
Summary 2 and Tasks 4, 5, and 6 are Auto-Scheduled. Change Task 4 to 10 days in duration. A new finish date is calculated for the task, and its summary task, and the duration rollup on the summary task now spans 10 working days.
Note
Unlike the rollup at the summary level for fields such as work and cost, the duration rollup is not summative; it summarizes the entire period of the WBS elements indented below it.
Change Summary 2 to Manually Scheduled and change the duration of Task 5 to 12 days. The rollup on the summary level is not calculated.
Change Summary 2 back to Auto Scheduled. Notice that the timespan is rolled up to the summary, not the sum of all of the durations of the tasks indented below.
Make sure Task 4's duration is 10 days, change Task 5's to 2 weeks, and then change Task 6's to 80 hours. Enter a new Auto Scheduled Task 7 at the same level as Task 6 and enter a duration of 4,800 minutes. Enter a new Auto Scheduled Task 8 at the same level as Task 7 and enter a duration of .5 months. These tasks are all the same duration based on the duration conversions in Project Options, so the rollup is still 10 days.
What would the duration of Summary 2 be if you linked Task 4 - 8? Try it, were you right?
You should be able to explain why all four of those Tasks, 4, 5, 6, 7, and 8, are the same duration. If you are not clear on why those tasks have the same duration, review the Project Calendar and Calendar Options for this project: in the Schedule category in Options.
Save this project.
When Finished with Exercise 2
The file Task Mode 2.mpp should have the same durations as in the figure below. The first four WBS elements are manually scheduled, and the next six are auto scheduled. The durations for Summary 2 and the indented activities should also be the same as in the figure.
(4)
Figure 7.12 Exercise results, rollup of duration on the summary level.
Best Practice
If you are using Manually Scheduled WBS elements, you are missing the primary purpose of project management software. By the time you are determining schedule logic, all WBS elements should be automatically scheduled at this point in the planning process.
Exercise 3: Select Task Mode and Timing Constraints Your Master Project (30 minutes)
Open your Master Project and do the following:
Make sure all WBS elements are Auto Scheduled.
Select the appropriate Timing Constraints for activities and milestones.
Ensure that the Timing Constraints for summary elements are ASAP.
When Finished with Exercise 3
All WBS elements in your Master Project are Automatically Scheduled, and you have applied the correct Timing Constraints to activities, milestones, and summary elements.
(4)
Exercise 4: Review Calculation Engine (15 minutes)
As we link WBS elements, our schedule takes shape. Before starting to link, let’s review Microsoft Project’s calculation engine. If you started with the first chapter, we have covered much of this in a previous chapter. If you did, consider this a quick review.
Click the Download icon above to download the Scheduling Engine.mpp file.
This exercise reviews the Calculation Engine rules and the subsequent impact of each feature’s rules on the schedule. The software’s features have specific rules that must be understood to understand how elements are scheduled. In addition, some features, if needed, may or may not be based on project management thinking; they are just software features.
It is a bit like driving an automobile. The purpose of a car is to take a trip, and the car has all kinds of features to help you do that safely and comfortably. In many ways, all automobiles are alike. Traditional Project Management software also works pretty much the same way. It uses the same tools and techniques and follows pretty much the same sets of scheduling rules.
When driving an automobile, there are the “rules of the road” that we have to learn, and of course, different manufacturers approach this idea of “safely and comfortably” in distinct ways. With today’s cars, there is a standard set of safety features, such as safety belts, airbags, antilock brakes, backup cameras, and traction control, but more and more automobiles are becoming distinctive in the way safety features, and other characteristics make, and models are designed and used. For instance, The Washington Post described Tesla as less of a traditional automobile and more of an iPhone on wheels.
In Microsoft Project, certain features related to specific rules are related to standard project management techniques, such as Critical Path Method. However, redefining what is Critical is unique to Microsoft Project as a project management software tool.
Case Notes

Doha, Qatar: Learning the Roundabout
When I went to help a group at Texas A&M University in Doha, Qatar, set up Project Server, I was excited for an adventure. Doha is famous for its luxury cars, and I pictured myself renting a sports car, driving into the desert toward Saudi Arabia, and living out my own Top Gear moment.
My customer quickly put an end to that idea.
"No," he said. "You can't have a car."
When I asked why, he said I would probably get into trouble in one of Doha's famous roundabouts. Back then, many big intersections were huge traffic circles where cars sped in from all directions. Learning to handle them took time, and my customer said that visitors shouldn't try to figure them out on their own.
He added another concern.
"The roads are covered with cameras. When you get to the airport to leave the country, they will have a list of your traffic violations waiting for you. If you don't pay them, you don't leave."
Then he smiled.
"We have a driver for you."
One of the younger members of the team laughed and said, "Our visitors are lucky."
He told me about arriving from College Station, Texas, in his twenties. The university had provided him with an apartment and a car, and the next morning he had to drive himself to work.
"I have no idea how I got through the Jaidah Roundabout," he said. "I was terrified."
A few days later, I understood exactly what he meant.
Every morning, our driver took us through a huge roundabout near the Al Jazeera headquarters. Cars came at us from all directions. Each time we made it through, I would say, "I can't believe we made it through that."
One day, I asked the driver how long he had been driving for Education City.
"Five years," he replied.
"And how many times have you gone through this roundabout?"
"Oh, many times every day."
I laughed and asked, "So it doesn't bother you anymore?"
He shook his head.
"I am still afraid."
That conversation stuck with me because it reminded me of something I often see when organizations start using Microsoft Project or Project Server.
The software isn't especially hard to learn. The real challenge is figuring out the rules behind how it works.
A lot of organizations think project managers can just sit down with Microsoft Project and start building schedules. Some can. But if you don't know how the Calculation Engine works, how dependencies set dates, how constraints change flexibility, and how best practices keep things consistent, every project manager ends up taking a different path through the roundabout.
The result is easy to guess. Every schedule looks different. Some work, but many don't.

Over the years, I have looked at schedules for big capital projects, software rollouts, and government programs that were much more complicated than any traffic circle in Doha. Often, we had to rebuild these schedules from scratch because the logic behind them just didn’t work.
The software itself wasn’t the problem.
The real issue was that no one had shown the drivers the rules of the road.
Later on that trip, my hosts brought me to a camel race in the desert. Next to the track, almost a hundred new vehicles waited to be given out as prizes. The event felt both familiar and different. There were competitors, trainers, spectators, and traditions, just like horse racing in the United States. But the rules, customs, and culture were all unique. The sport even used robot jockeys, a new technology that replaced child jockeys after reforms in the early 2000s.
That experience taught me the same lesson again.
Camel racing works because everyone involved knows the rules. The same goes for American football. Microsoft Project is effective when project managers understand how it works.
Each system has its own way of working, its own terms, and its own best practices.
Success usually doesn’t come from trying to use one set of rules in a different setting. It comes from understanding the system you’re in and learning how to work within it.
Just like with the roundabouts in Doha, Microsoft Project feels much less overwhelming once you understand how things move and connect.

If you have ever driven a Mazda, you may be familiar with the Japanese expression Jinba Ittai, often translated as "horse and rider as one." The phrase describes the deep connection that develops between a skilled rider and a horse—a relationship in which communication becomes almost instinctive and the two move together as a single unit.
Mazda adopted this philosophy as a design principle. Their goal is not simply to build cars that are safe, comfortable, and reliable. They strive to build vehicles that feel like a natural extension of the driver. Mazda describes this as a human-centric approach to design—creating cars that adapt to the driver rather than forcing the driver to adapt to the car.
I was hiking the Speyside Way in Scotland with my wife when I called an Uber one afternoon to take us from the trail to one of my favorite Scotch whisky distilleries. The driver arrived in a shiny MazdaSpeed3 and immediately began talking about how much she loved driving it. During the trip, we discussed the design features that made the car feel responsive and connected to the driver. She described it almost the way a sailor talks about a favorite boat or a pilot talks about a favorite aircraft. The machine seemed to disappear, leaving only the experience.
That conversation stayed with me because it reminded me of something I have observed repeatedly when teaching Microsoft Project.
New users often view the software as complicated, restrictive, and filled with rules. In many ways, they are right. There are rules governing task modes, dependencies, timing constraints, deadlines, calendars, critical path calculations, and many other aspects of the calculation engine. At first, these rules can feel overwhelming.
Over time, however, something changes.
As project managers learn the rules and gain experience applying them, the software begins to feel less like a collection of menus, commands, and calculations and more like a natural extension of how they think about projects. They stop focusing on which button to click and start focusing on the work itself. The schedule becomes easier to build, analyze, and trust.
The two previous Case Notes illustrated this idea from different perspectives. The roundabouts in Doha worked because drivers understood the rules of the road. The procedures at the Defense Logistics Agency worked because people followed a common set of standards and expectations. Microsoft Project is no different. The software rewards those who understand its rules and work within them.
Whether Microsoft Project ever becomes as enjoyable to use as driving a favorite sports car is something you will have to decide for yourself. What I can say is that the more thoroughly you understand the scheduling rules and best practices behind the software, the stronger the connection between you and the tool becomes.
The goal is not merely to learn Microsoft Project.
The goal is to reach a point where the software becomes a natural extension of how you think about planning, scheduling, and managing projects.
With that in mind, let's review some of the most important scheduling rules in Microsoft Project. Many of these concepts were introduced earlier in the MS Project Master Class, but they are important enough to revisit before moving forward.
Calculation Engine
Open the Scheduling Engine.mpp file. As shown in the figure below, a scheduling message appears when you open this file. If you do not see a scheduling message, turn on scheduling messages; they are helpful to see. Scheduling messages are a Global setting that can be turned on or off in Options (File / Options / Schedule / Schedule / Show scheduling messages). Exit the project, then reopen it, and you will see this scheduling message.
These scheduling messages typically occur when a fixed or semi-flexible Timing Constraint conflicts with a Link. The Timing Constraint sets a scheduled date, such as Start No Later Than a date, while the Link wants to push the start date further out.
Usually, but not in this particular case, these messages can help you identify a problem in the schedule and which WBS elements are involved in the scheduling problem. As it turns out, this particular scheduling message is about as helpful as the check engine light on most cars and makes a couple of faulty suggestions.
Even though the message is unclear, it still gives you an idea of where to look for the problem.
Figure 7.13 Scheduling message.
It would be more useful for the schedule message to say:
Figure 7.14 Proposed schedule conflict messager.
Figure 7.15 Negative Total Slack caused by a Timing Constraint conflict with a Link.
The scheduling message above does point us in the right direction. The figure directly above shows that the schedule is being pushed past the Must Finish On Timing Constraint on the last WBS element. There are three days of negative slack, meaning the schedule needs to be brought in by three working days to be completed on time.
These are the primary features and scheduling rules to review or check for a project.
Calculation
Check to make sure the Calculation is on. If not, changes will not be calculated when data is entered or changed. (Options / Schedule category / Calculation / Calculate project after each edit: / On.)
There are a couple of practical reasons to turn Calculation off. One reason is performance; on extensive schedules or when loading Master Projects with many large projects inserted, there might be an irritating wait time for the schedule to calculate when entering updates. If you have Calculation off, you can enter data and calculate when you want by pressing the F9 key.
Give it a try. Turn off the Calculate project after each edit. Enter two new activities at the end of the WBS outline, giving both a duration of 5 days, and then link them together. There was a minor calculation when Duration was entered, but the activities are just hanging there and ready to be calculated. Press F9 to calculate.
Turn auto calculation back on.
Project Information (Start Date, Scheduling, and the Project Calendar)
Open Project Information (Project tab / Project Information command). Check the Start Date, Scheduling From selection, and what project Calendar is being used.
Note that the schedule starts on 1/1/2021 and that the Project Start milestone in the schedule does start on the 1st. This milestone is a predecessor (Finish to Start type with zero lead or lag), but the next activity, #3, Finalize Course Design, is not scheduled to start until the 4th. Why?
Explain why in the Notes field for the activity Finalize Course Design.
Calendars
Open Change Working Time (Project tab / Change Working Time command) and note the exceptions and how a workweek and workday are defined for the Standard Calendar. Click the Options button and note that the selections are congruent with the calendar's definition.
Click Cancel. In the For calendar: field, select the 7-Day—No Holidays calendar, review its definition, and click OK or Cancel.
The Standard Calendar determines the working and non-working days for the schedule. The project has 104 working days as defined by the Standard calendar, not calendar days. Convert that number to weeks (File tab / Options / Schedule category / Scheduling options for this project). Change the Duration entered in to Months.
Remember the five scheduling rules for calendars? The question has been on the last three review exams.
Note
Every duration in Microsoft Project is in working time, as defined by the calendar in use. If a WBS element was 1 year in duration, the number of days would be the number of working days defined for that year.
The project is almost four months and three weeks in calendar time. If you were reporting on this project,104 days might be considered calendar time instead of working time. Saying the project is a week short of five months is a little easier for people to understand.
Observe the Indicators for activity #12, Shoot Final Video. The indicators tell us that there are activity notes and that the activity uses the 7 Day - No Holidays calendar.
Check the calendar selections for this activity—Double-click on activity # 2. Select the Advanced tab in the Task Information dialog box, note the calendar selected, and that the Scheduling ignores resource calendars is checked d. Notice that the activity runs five days straight through the weekend, even though the project calendar has a five-day workweek and the resource assigned to the activity is likely using a different calendar than the 7 Day - No Holidays calendar.
Check the resources calendar. In the bottom Task Form view, apply the Work theme and double-click on the Production and Manufacturing Manager assigned to the activity. In the Resource Information dialog box, click the Change Working Time…button and note that this resource uses the Standard calendar. In Task Notes, make a note to ensure the manager's commitment to work this weekend. Bold the note in red to make it stand out.
Timing Constraints
Most elements in this schedule have ASAP timing constraints, which means they are being pushed toward the start of the project. The Project Finish milestone is Must Finish On, 5/25/21, and #7, Produce Scratch Audio, is ALAP. Change #7 to ASAP and notice the element is no longer critical or on the critical path. Completing the activity "Produce Scratch Audio" as late as possible should improve performance on this activity, although making it critical carries some risk. Right now, most of the elements in this project are critical.
Links
Most elements in this schedule have standard Finish to Start links with zero lead or lag. Identify the two elements using different types of Links and highlight them in green.
Effort Driven Scheduling
Look at the Project Finish milestone and the information in the Total Slack column. We will review this field and related fields in the next section on the Critical Path Method. For now, negative three days means the schedule needs to be brought in by three working days so that this milestone can meet the Must Finish On date.
Let’s say #6, Develop Draft Material, is one of those activities that can be shortened by assigning additional resources.
Select activity #6 and note in the Task Form view at the bottom of the split window that the Task Type for element #6 is Fixed Work. Therefore, assigning an additional resource will proportionately reduce the element's duration.
In the bottom Task Form view, assign the Instructional Designer to the activity. The activity duration is cut by almost a third, the last element no longer has negative slack (float), and the critical path is much more realistic. Most elements have more than a week of slack.
Resource Leveling
We have not reviewed this feature yet, but it is always essential to evaluate Resource Leveling when reviewing a project’s calculation engine settings.
Resource Leveling is a set of features that will delay activities around resource availability.
First, check if the leveling calculations are automatically applied (Resource tab / LevelingOptions command). They should be Manual.
If you are uncertain whether the schedule has been leveled in the past, you can clear leveling for the entire project (Resource tab / Clear Leveling common). Alternatively, you can insert the column Leveling Delay to check if any elements are currently leveled.
Save the project. Consider compiling your list of things to check to ensure your schedule is calculated correctly.
Warning
Microsoft routinely changes the calculation engine. Upgrading to a new version or applying an update can cause a schedule to be calculated differently.
Field Note

Using Baselines: When the Same Schedule Isn't the Same Schedule
When working on large Microsoft Project Server deployments, especially during migrations or upgrades involving hundreds of files, we learned something important: do not assume a schedule will calculate the same way just because it appears unchanged.
During our deployment process, we often used an unused baseline, usually Baseline 9, to record each project's state before migration. After importing the schedules into the new system, we used custom views, tables, filters, and fields to compare the original schedules with the new ones. Our goal was to spot any differences in duration, work, cost, start dates, finish dates, or other calculated values.
Most of the time, the schedules matched closely. Sometimes, though, we found big differences.
This surprised many project managers at first. It was the same project, with the same activities and dependencies. So why did the results change?
The reason is that a Microsoft Project schedule is more than just a list of tasks. It is a mathematical model shaped by calendars, dependencies, resource assignments, enterprise settings, custom fields, calculation options, and many scheduling rules. Even small changes in these areas can lead to different results.
These deployments taught me an important project management lesson. A schedule is not the project itself; it is just a model of the project. If the rules, assumptions, or calculation engine change, you should always check the model.
That is why experienced project managers focus on baselines, validation, and schedule reviews. It is important to trust the software, but it is equally important to ensure it delivers the results you expect.
As with many things in project management, the lesson is straightforward:
Trust the schedule, but always check the calculations behind it.
When Finished with Exercise 4
The Scheduling Engine.mpp file should look similar to the one in the figure below.
The duration of the project should be about 4.6 months.
The two activities that have non-standard dependencies should be highlighted in green.
#7 should be ASAP.
#6 should have the Instructional Designer assigned.
#12 should have notes in bold red.
All elements should have some slack.
(4)
Figure 7.16 Exercise Results.
Field Note
Is it Me or Microsoft Project: Before You Blame the Software
When I get a project plan that seems to have calculation errors, I don’t usually start by checking the Activities and dependencies. I first look at the main selections that affect the Calculation Engine.
First, I review the project calendar and the scheduling options in Microsoft Project. I also see if any task calendars are overriding the main calendar. After that, I check if resource leveling has been used and if any leveling delays are in the schedule. Finally, I look for Manually Scheduled tasks, since they often work differently than people expect.
Most of the time, I find the cause of the problem in just a few minutes.
I start with these checks because Microsoft Project usually works as expected when its rules are followed. Most surprises come from a missed calendar, constraint, scheduling option, resource-leveling choice, or manual scheduling setting.

Years ago, I worked with a customer whose job was to analyze large capital projects, often for the government, that had run into big delays, extra costs, or disputes and sometimes ended up in court. Their team would review project plans to assess whether they were properly managed and whether the software was used correctly.
Their analysts looked at many of the same things I check: calendars, constraints, scheduling options, resource-leveling choices, task modes, and other settings that affect how the Calculation Engine works. If they found that the scheduling team had used the software incorrectly or set up the schedule in a way that gave misleading results, that could become part of expert testimony about who was responsible for the project’s outcome.
That experience taught me an important lesson. A project plan is not just a list of elements and dates. It is a model based on assumptions, rules, and calculations. If those rules are misunderstood or applied incorrectly, the schedule might not reflect what’s really happening.
That’s why experienced project managers don’t blame the software right away when something seems off. They first check the settings, assumptions, and logic behind the Calculation Engine.
Most of the time, that’s where the real problem turns up.
Field Note
Necessary Work: Preventive Maintenance
Over the years, I’ve learned that experienced project managers don’t just create schedules and hope for the best. Like any important system, schedules need regular checks and maintenance.
There are several tools made for this job. I’ve used Project Analyzer by Steelray for a long time, and lately I’ve been using Schedule Inspector by Barbecana. It checks schedules using the DCMA 14-Point Assessment and other quality standards. It’s easy to use, affordable, and gives helpful feedback on your schedule’s health.

What I like about these tools is that they do more than just check dates and durations. They look at the quality of the schedule itself. They spot missing logic, too many constraints, open ends, too much lag, invalid links, and other issues that can make it hard for a project to predict results accurately.
I think every serious Microsoft Project user should try one of these schedule-analysis tools. There are plenty of good options, but what matters most is making a habit of checking your schedules regularly.
When I coach people or teams in this MS Project Master Class, I follow the same routine every week before reviewing their Master Project. First, I check the main Calculation Engine settings and scheduling options. Then I run Schedule Inspector to find any issues with logic, constraints, dependencies, or other schedule quality factors.
I only start reviewing the schedule after I finish those checks.
This process is like a pilot doing a preflight check or a mechanic doing routine maintenance. These steps don’t directly move the project forward, but they help ensure the project plan can be trusted to deliver reliable results.
That difference matters.
Many project managers spend a lot of time reviewing reports, dashboards, and critical paths without first confirming that the schedule is solid. But if the schedule has poor logic, too many constraints, or incorrect settings, it can produce misleading results, no matter how good the reports look.
A schedule is only as good as the rules, assumptions, and logic it’s built on. Project inspection helps ensure that the Calculation Engine uses accurate information and that the project plan remains a dependable model throughout the project's life cycle.
Exercise 5: Link Activities and Milestones (10 minutes)
This exercise will look at the various ways to set and edit links or dependencies.
Watch the video below on “The five ways of setting and editing links in Microsoft Project” (7:24 minutes). During this exercise, you will create links in several different ways.
The fives ways to et and edit links in Microsoft Project
Download
Click the Download icon above to download the Types of Links.mpp file.
In the Types of Links.mpp file:
Select the Start task and Task 1, right-click, and link them together using the Link command on the little toolbar at the top. You can also select tasks and use the Link command in the Schedule group under the Task tab.
Double-click on Task 2, go to the Predecessors tab, and make Task 1 a predecessor with a Finish to Start type and a 2-day lead.
Once a type of link is selected, lead or lag can be added. It is lag if the task is pushed toward the finish date or it is lead, bringing the task closer to the start date. In this case, enter -2 days in the lag field. Those negative two days bring the task closer to the start date.
Next:
Split the window (View/check Details). Right-click and apply the Predecessors & Successors detail in the Task Form view below. Select Task 3 in the top view. Using the form in the bottom view, change the dependency and Make Task 3 a Start to Start successor of Task 2, with a three-day lag. Task 3 will start three days after Task 2 starts.
Drag the taskbars to make Task 3 a predecessor of Task 4. Move the cursor over the Task 3 taskbar and notice the move tool with the four arrows pointing in four directions. Click, hold, and then move the cursor up or down; the move tool turns into the link tool. Drag the link tool from the Task 3 taskbar to the Task 4 taskbar to link them together in a standard link or dependency.
Double-click the link between Task 3 and Task 4 to open the Task Dependency dialog box. In the Finish to Start type of relationship, add 25% lead.
Make Task 4 a predecessor of Finish by entering 5 in the Predecessor column for the Finish milestone.
Save the project
In this example, Task 2 does not have a successor, but the best practice is that every activity should have at least one successor, so it needs to be finished before the end of the project. To make it a predecessor to Finish, select Task 2, press the Control key, select the Finish task, right-click, and then click the Link command.
This is worth mentioning at this point. The project has an auto-link feature that links inserted or moved tasks to the tasks above and below that placement.
To turn Autolink on or off, go to File on the ribbon / Options / Schedule / Scheduling options in this project: / check or uncheck Autolink inserted or moved tasks.
Save the project.
We just covered nine ways to set and edit links. Unlike many features in most software, knowing how to accomplish something with an Office product isn’t always essential or valuable. However, with linking in Microsoft Project, it is helpful to understand how to edit them wherever you are in the software. Linking, making adjustments to links, is an ongoing activity during the planning and execution phases.
Remember, adding a lead to a dependency brings the successor closer to the start date, while lag moves the successor closer to the finish date or further out in the schedule.
The following figure illustrates a lag in the start-to-start relationship between Task 3 and Task 4. There is also a lag in the finish-to-finish relationship between Task 5 and Task 6.
There is no lead field in Microsoft Project, only a Lag field. The lag number, negative or positive, determines if it is lead or lag depending on the type of link used.
Figure 7.17 Types of links or dependencies in Microsoft Project.
When Finished with Exercise 5
The Types of Links.mpp file should have the same links as those in the figure below.
(4)
Figure 7.18 Exercise results for the type of links in Microsoft Project.
Exercise 6: Link Activities and Milestones in Your Master Project (30 minutes)
Open your Master Project and complete the following:
Link all of your activities and milestones. Except for the Project Started and Project Finished tasks, all activities and milestones should have at least one predecessor and one successor.
Avoid redundancy in your linking.
Ensure summary elements have no links.
When Finished with Exercise 6
Your Master Project should now have preliminary scope, time, work, and cost estimates. The WBS is the scope estimate. If all those tasks are completed, the product, service, or result will be delivered along with the project objectives. You can review the work, cost, and schedule on the project summary level.
It is tempting to consider the project estimating phase nearly completed at this point; however, we have several more things to consider and plan around, such as risk and resource availability.
(4)
Exercise 7: Analyze Critical Path (20 minutes)
In this exercise, we will review the Critical Path Method. The actual exercise will only take a couple of minutes.
Download
Click the Download icon above to download the Boulder to Tampa.mpp file.
In addition to the graphic above on the different types of links, we will review nine additional graphics (#2-10) until you have a good sense of the Critical Path Method.
While you review these points of calculation, remember that the float or slack that determines if an element is on the critical path, an element is marked as Critical in Microsoft Project for other schedule restrictions like a Must Finish On timing constraint.

Figure 7.19 Forward pass and backwards pass calculations.
Graphic 2
We have been calculating the forward pass since we were kids when we calculated point A to point B. The Backward Pass is really what is new in the Critical Path Method.
Ilustration
Cross Country Trip: Calculating the Earliest Arrival
My wife and I drive between Boulder, Colorado and Tampa, Florida a couple of times each year. Instead of always taking the quickest route, we like to use these trips to see new places or return to spots that mean a lot to us.
On our next trip, I want to stop in Ada, Oklahoma, where my parents grew up. After that, we’ll head to Mobile, Alabama. I’ve been to Mobile a few times for work and on trips, but my wife hasn’t. Plus, I’m looking forward to eating at Osman's again.
Here’s what our trip could look like:
Boulder to Ada: 12 hours.
Stay in Ada: 2 nights (39 hours).
Ada to Mobile: 11 hours.
Stay in Mobile: 2 nights (37 hours).
Mobile to Tampa: 7 hours.
Most people actually do a forward-pass calculation when planning a trip like this, even if they don’t realize it is the first part of the Critical Path Method.
We start at the beginning and add up the time for each part of the trip. First, we drive to Ada. Then we stay in Ada. Next, we drive to Mobile, stay there, and finally drive to Tampa.
As we add each part of the trip, we figure out the earliest we can get to the next place. By the end, we know the soonest we could arrive in Tampa, as long as everything goes as planned.
This is exactly what the Critical Path Method does during a forward pass calculation. Starting from the project start date, the Calculation Engine processes each activity sequence and calculates the earliest start and finish dates for each activity in the schedule. When the calculation reaches the end of the project, it determines the earliest possible completion date based on the defined logic and durations.
The key thing to remember is that the software isn’t making up dates. It just adds up the times and connections you’ve given it, just like you do when planning a long trip.
In both cases, we’re really answering the same question:
Given everything that needs to happen, what’s the earliest we can finish?

Figure 7.20 Boulder to Tampa, forward pass in the Critical Path Method.
Of course, Google Maps doesn’t let you enter stops or stays. However, if this information was entered in Project, you could enter stops and obtain as much detail as needed to meet almost any scheduling requirement.
Open the Boulder to Tampa.mpp file.
This is my next trip. I am leaving Thursday, the 18th, at 6 AM and am expected to arrive in Tampa on Monday, the 22nd, at 4 PM. If I make any changes, the schedule will be recalculated immediately.
Because of how I think about this schedule, I used the 24-hour calendar to travel on weekends, etc. However, if you look at the figure below, Microsoft Project tells me the trip will take over 13 days. Something isn’t calculating correctly!
Figure 7.21 Trip from Boulder to Tampa with stops.
The schedule looks correct, but the rollup on the summary level can’t be over 13 days!
We have reviewed this particular issue three or four times. Consider what you know about the calculation engine and the selections in places like Project Options.
Debug and correct the problem, then save the project.
Critical Path Method
This next section reviews the calculations and related fields in Critical Path Method.
Figure 7.22 Total and Free Slack.
Graphic 3
The Backward Pass is the part of the Critical Path Method that is new to most of us.
Once the Forward Pass Calculation is complete, the schedule's end date and the Early Start and Early Finish dates for all elements are calculated.
In Microsoft Project, The Early Start field is the same as the Start field, and the Early Finish field is the same as the Finish field. These are just redundant fields.
Once the Backward Pass Calculation is complete, Total Slack (Float) and Free Slack can be calculated. Total Slack is the amount of time an element can slip without pushing out the end of the project (if the end of the project has a Timing Constraint or Deadline). An element of zero Total Slack means it is Critical if the default definition of Critical is used and zero Slack is selected in Project Options.
Free Slack is the amount of time an element can be delayed without pushing out the start date of the immediate successor. An element could have zero Free Slack but have time in the Total Slack field and, thus, not be marked as Critical.
Note
On a reasonably sized project plan, these calculations occur immediately when you make changes to the schedule. Those of us who worked with early versions of Microsoft Project and other project management software remember that the speed of its calculations is one of the leading reasons for the software’s prominence in the industry.
Figure 7.23 Notes on Critical Path Method in Microsoft Project.
Graphic 4
Remember, in Microsoft Project, all durations and dates are in Working Time, as defined by the project calendars.
Microsoft Project uses the term Slack for the more commonly used term Float. If there is a negative number in the Total Slack field, that number (called Negative Slack) is the amount of working time that task needs to be brought in toward the start date for the project to be completed on time.
Figure 7.24 Network graphic used to illustrate CPM calculation.
Graphic 5
The following screens are the Critical Path Method (CPM) calculations.
This is a network diagram, like the Network Diagram view in Microsoft Project.
Each square is a node in the network diagram. The network nodes, or the boxes in this graphic, are activities in Microsoft Project.
The task name, duration, and links are all user-entered.
Early Start, Early Finish, Late Finish, Late Start, Total Slack, Negative Slack, and Free Slack.
Figue 7.25 Forward pass calculations.
Graphic 6
During the Forward Pass, Early Start and Early Finish are calculated.
Let’s say the first task (A) starts at zero. The Early Finish for the task (A) is (Early Start + Duration = 3).
Task (B) starts right after (A), its Early Start is 3 (Early Start + Duration = 5).
The longest path in this network diagram is 29, which becomes the project duration (PD) or scheduled finish date.
If these numbers in this graphic represent days, this project is 29 days in duration.
Figure 7.26 Backward Pass calcuation in the CPM.
Graphic 7
Once the Forward Pass is completed, the Backward Pass can be calculated.
Starting with the last task (G), the Early Finish is 29; the Late Finish is the same number.
Late Start for task (G) is (Late Finish - Duration = 24)
Late Start and Early Start, along with the Early Finish and Late Finish for the first and last tasks in a network diagram, are the same.
Figure 7.27 Total Slack (Float) calculation.
Graphic 8
Once the Backward Pass has been calculated, Slack is calculated.
Total Slack for an element is the difference between Early Finish and Late Finish.
For element (D), the difference between 21 and 24 is 3. This element has 3 Total Slack, which is not on the critical path.
Figure 7.28 Critical Path.
Graphic 9
Once Total Slack is calculated, the Critical Path can be easily identified.
The critical Path is the longest Path or sequence of project activities that control the earliest a project is expected to finish.
Figure 7.29 Free Slack (Float).
Graphic 10
Free Slack is the amount of time that an activity can be delayed without delaying the start date of any immediate successor activities.
Mathematically, free float (slack) is calculated as the difference between an activity’s early finish date and the early start date of its immediate successors. If there is no difference, then the activity has no Free Float.
Technically, and this may be the case in Project, Free Slack can be calculated during the Forward Pass.
Task (C) is not on the Critical Path, but if the task is delayed, it will push out the Early Start date of task (D). If it is delayed more than 3, it will push out the start of (D) and the end date of the schedule.
When Finished with Exercise 7
After this review, you should have a good understanding of CPM calculations. Microsoft Project has fields for all of these calculations:
Early Start (Separate, but same calculation for Start)
Early Finish (Separate, but same calculation for Finish)
Last Start
Late Finish
Total Slack
Free Slack
Project Duration (Duration field on the Project Summary Level)
You should have figured out what was causing the miscalculation on the project summary level for the Boulder to Tampa.mpp file. The duration should be 4.42 days as shown in the figure below.
(4)
Figure 7.30 Schedule with the correct duration calculation on the summary level.
Exercise 8: Format Network Diagram (40 minutes)
One of the primary views in Microsoft Project is the network diagram. Working with the network diagram view in Microsoft Project is much different than working with the other 16 types of views. In this exercise, you will format or create a new template and then import that template into a new network diagram view.
In addition, we will look at the fields used for the Critical Path Method in a Gantt Chart view.
Download
Click the Download icon above to open the CPM1.mpp file.
This project opens with the Network Diagram view applied. While in this view, let’s look at the features associated with this view.
Network diagrams aren’t used much these days, mostly because we have limited our experience to our screens, and our screens, especially laptops, are not conducive to viewing large graphical output. Printing a network diagram was very common, more than even printing Gantt Charts. Early in project management computing, one of the first things my customers would ask me when they became proficient in using the software was recommendations for plotters. I was asked this question so many times that I considered becoming a reseller for several better plotters.
If you are in an engineering environment and have access to a plotter, you could easily find that printing a network diagram is an important part of your project management practice. Personally, the single biggest impact on project teams I have seen in my decades of working with these tools has been weekly and, in some cases, daily printing of time-scaled network diagrams.
Although we don’t use this view as much, it is still the best place to check dependencies.
Figure 7.31 Network Diagram with the Format tab on the ribbon selected.
Figure 7.32 Box Styles dialog box for the Network Diagram view.
The Format group resembles the function of editing elementbars in a Gantt Chart view. Edits can be made to a selected element (Box command) or the entire network (Box Styles command). The Layout command opens a dialog box for general graphical layout features. Allow manual box positioning will allow you to manually move the boxes around for display purposes. Moving the boxes does not change the schedule. When this radio button is selected, the Layout group becomes active. The Layout Now and Align commands can reposition the nodes (boxes). Again, this does not affect the schedule in any way.
The Box Styles command opens the Box Styles dialog box, allowing you to edit or design your Network Diagram for all items in the box's Style setting.
These style items are:
Critical (elements that have zero slack or the specified amount of slack or less defined for a critical element in Options)
Noncritical
Noncritical Milestone
Critical Summary
Noncritical Summary
Critical Inserted Project (when another *mpp file has been inserted in the active project)
Critical Marked (there is a field called Marked; it is a Yes/No field. This field allows you to flag an element for any reason)
Noncritical Marked (there is a field called Marked; it is a Yes/No field. This field will enable you to flag an element for any reason)
Critical External (an external link to an element in another *.mpp file)
Noncritical External (an external link to an element in another *.mpp file)
Project Summary (Row zero or the project summary element)
Click on the different items in this box and note that there are various selections below for each item selected.
Templates determine what field data is displayed for a particular item. For instance, in the Styles box, Select Critical Summary and then Noncritical Summary. Both items use the same Template; the only difference is the Border and Background selections.
You can edit and create your Templates. They are not stored in the Global.MPT file or accessed by using the Organizer. Templates for a Network Diagram view type are stored within that particular view. In this case, a view named Network Diagram is applied, and we see the available templates in that view. Views are stored in either the active project file or in the Global.MPT files are copied, moved, or deleted in the Organizer.
Boxes can be drawn for elements that meet 13 different style criteria, such as Critical. A data template is selected for each style criterion, which determines the element fields shown in the box.
In this example, the Template (Example—Critical Path) is a custom Template. In each box, Critical Path Method data is displayed for Critical, Noncritical, and Critical Milestone nodes (elements). However, Total Slack and Free Slack are not shown.
Add the two element fields, Total Slack and Free Slack, to the Example—Critical Path Template, as shown in the figure below. Select the Cell Layout button to ensure there are enough rows, then add the Total Slack and Free Slack fields from the drop-down list of fields. Arrange both fields like those in the figure below.
Figure 7.33 Box Style and the Data Templates dialog boxes.
To do this,
Click on More Templates… and select the Example - Critical Path Template.
Click Edit. Add another row, and on this row, add the Free Slack and Total Slack fields. First, make sure you have the available rows, so click Cell Layout… and add a 4th row.
Add Total Slack and Free Slack fields and be sure to Show Label in cell: and then Click Ok / Close / Ok to note changes.
Save the project to save your changes.
When Finished With This Part of Exercise 8
At this point, with the CPM1.mpp file, your nodes should have the same fields as those in the figure below. Don’t worry if there are other differences.
(4)
Figure 7.34 Network Diagram highlighting critical tasks (nodes) and displaying CPM calculations.
You can also share these Network Diagram Box Templates between projects. In this next section, you will open your Master Project, create a new Network Diagram view, and import the Example—Critical Path Template into this new view.
Effectively working with custom elements like Views and the associated aspects of those elements greatly enhance your experience with Microsoft Project. In addition, it will save considerable time when you learn to share customization between schedules and versions of Microsoft Project. It would be great if all custom elements were stored and shared in one place like the Organizer. In this case, the change to the template is associated with the Network Diagram view, and it is not an element displayed or managed by the Organizer. However, the Organizer will still manage the view that the template is kept.
While we do this import, I want to illustrate another feature related to the Organizer, so I would like you to turn a selection on that; earlier in this MS Project Master Class, I suggested you keep it turned off. Go to File / Options / Advanced / Display and put a checkmark next to Automatically add new views, tables, filters, and groups to the global.
This is a global setting, so be sure to uncheck this selection in Options when finished with this exercise.
Next, do the following:
In your Master Project, click the View tab on the ribbon to create a new network diagram view. Then click the Other Views command in the first group, More Views, and New.
Create a Single view and then give the view a name. Please remember this name.
In the Screen: field, select Network Diagram. In the Group: field, select No Group. In the Filter: field, select All Tasks. Then, go ahead and show this new view in the menu.
Click OK / Apply.
The next step is to import the Example - Critical Path Template from the Network Diagram view in the CPM1.mpp file, instead of creating it from scratch like we did above. You should be able to do this on your own.
With your Master Project active, select the Format tab, open Bar Styles, import the Example - Critical Path template, and select the imported template for Critical, Noncritical, and Critical Milestone items.
Last, let’s say you want to make this new network diagram available to any project you open in Microsoft Project.
To do this, you must ensure the network diagram view (the name you used above) is in the Global.MPT file, along with the imported template.
Go to the File tab on the ribbon / Info / Organizer and note that the view is already in the Global.MPT. When we created the network diagram view, it was placed there because of our selection in Options, which told the software to save new views to the Global.
However, notice that the view is also included in the project. These are two views with the same name in two different files or locations. When we imported the template to this new view we created, it was imported to the view associated with your project when you imported it. The view you created is available for any project you open because it is in the Global, but if you want that view to have the imported template, you will need to copy the view from Master Project and replace the one in the Global.MPT is illustrated in the next figure.
Save your project. Remember, changes to the Global.MPT file are saved when you exit Microsoft Project or if you save the Global.MPT file in the VBA Editor.
Figure 7.35 Using the Organizer to copy an element like a view or table associated with a project to the Global.MPT.
The Network Diagram view in the Global.The MPT file that ships with Microsoft Project has ten templates, as shown in the figure below. When a new Network Diagram type of view is created, only the Standard template is available in that new view. Remember that if you are designing a new Network Diagram, you might want a template in your new Network Diagram that is in the out of the box Network Diagram in the Global.MPT. You can import these templates into a new or existing Network Diagram view.
Figure 7.36 Templates in the Network Diagram view.
When Finished with the Second Part of Exercise 8
You created a new network diagram view in your Master Project. This view should contain the Example—Critical Path template shown in the following figure.
(4)
Figure 7.37 Exercise results, imported Template into a Network Diagram view.

Field Note
Time Scale Network Diagrams: Putting Schedule Logic on the Wall
One of the challenges with Network Diagrams is that they are often difficult to appreciate on a computer screen. Even with a large monitor, only a small portion of the project's logic is visible at one time. As a result, many Microsoft Project users spend most of their time working in the Gantt Chart view and rarely look at the Network Diagram.
That is unfortunate, as the Network Diagram is one of the best ways to visualize scheduling logic.
Over the years, I have worked with several organizations that valued large-format schedule displays on conference room walls, in project offices, and in teamwork areas. In those environments, the visual impact of a wall-sized Network Diagram can be remarkable. Team members can see not only their own work but also how their activities connect to the larger project. Dependencies, handoffs, bottlenecks, and critical path relationships become much easier to understand when the entire schedule is visible at once.
This is where third-party tools can be valuable. One company I have used for many years is Critical Tools. The company was founded in 1991, shortly after Microsoft released the Windows version of Microsoft Project in 1990, and has spent more than three decades developing products that extend Microsoft Project's reporting and visualization capabilities.
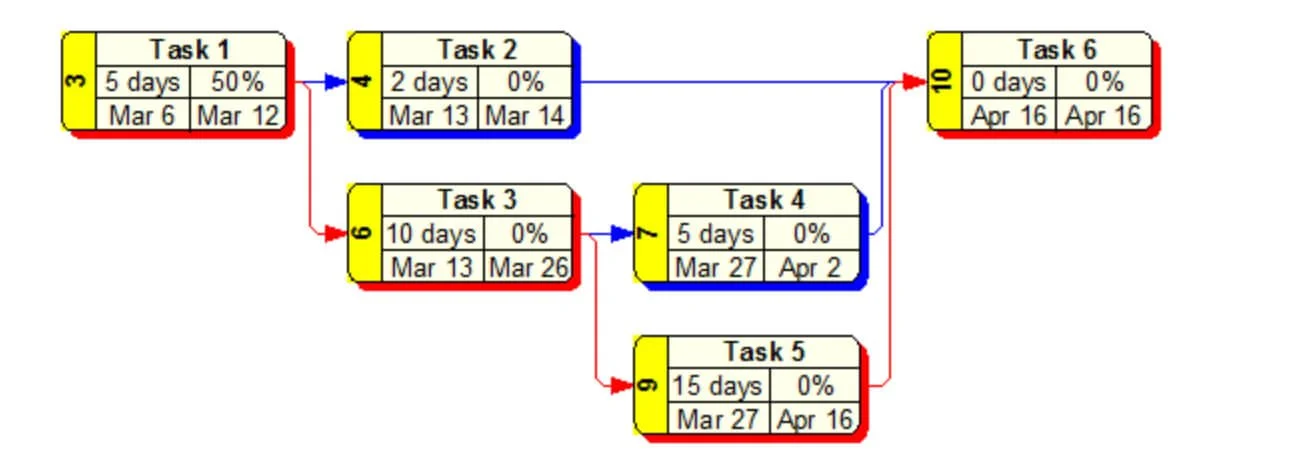
Two of the outputs I have found particularly useful are large-format Work Breakdown Structure (WBS) charts and Activity-on-Node (AON) timescale Network Diagrams, often referred to as PERT charts. Both provide perspectives that are difficult to obtain from a traditional Gantt chart. The WBS chart emphasizes project structure, while the Network Diagram emphasizes scheduling logic and relationships among activities.
When project teams review these diagrams regularly, something important happens. The schedule stops being a collection of individual assignments and becomes a shared model for how the project will be executed. People begin to see how their work affects others, where critical handoffs occur, and which activities truly drive project completion.
One of the central themes of this Activity is that Microsoft Project calculates schedules based on the logic you define. Large-format Network Diagrams provide one of the clearest ways to see that logic. They make dependencies visible, reveal the flow of work, and help teams understand the relationships that ultimately determine the project's finish date.
Before we finish this exercise, let’s look at the Critical Path Method in a Gantt Chart view, Microsoft Project’s central display.
Open your Master Project. The critical path is recalculated whenever you make a schedule change to your project.
Let’s change views and look at this critical path information in a Gantt Chart view.
Select the Task tab on the ribbon and click the Gantt Chart command.
Apply an existing table with the fields associated with critical path calculation (View / Tables / More Tables / Bridge Critical Path / Apply) and then zoom the entire project (View / Entire Project command). Note the early and late dates along with TS (Total Slack) and FS (Free Slack).
You can also display Critical Path and Total Slack in the Task Bars (Format / check the Critical Tasks and Slack commands).
As you know, the table applied to this Gantt Chart view contains a shortlist of items that can be automatically formatted. Change the background for the Critical Tasks item in Text Styles to automatically format the background of critical tasks.
Last, uncheck. Automatically add new views, tables, filters, and groups to the global. (File / Options / Advanced / Display.)
Save your Master Project.
When Finished with the Third Part of Exercise 8
The Gantt Chart view of your Master Project, you should have:
The Bridge Critical Path table is applied.
The background of the Critical Tasks, the Text Styles item, formatted.
Critical Tasks and Slack are displayed in Bar Styles, as shown in the figure below.
(4)
Figure 7.38 Exercise Results, Critical Formatted in the table and view. Slack formatted in the taskbars side of the window pane.
Best Practice
The critical path method begins with you reviewing a schedule and establishing links between activities and milestones.
In the first pass through the schedule, link tasks based on hard logic; ask, “What must precede an activity or milestone?”
During the second pass, apply soft logic. You can’t do everything at once, so ask, “What do I prefer to do before something else?”
Exercise 9: Analyze The 4 Hour House (40 minutes)
In this exercise, you will view a short video and discuss the techniques used to compress the duration of a project, along with fast-tracking and crashing.
Before doing the exercise, I want to share some related field notes and illustrations.
Field Notes

Value Engineering: Better, Faster, Cheaper
One of the most common phrases in project management is "better, faster, cheaper." From a value engineering perspective, those are the objectives of many projects. Organizations want improved quality, shorter schedules, and lower costs.
Not everyone believes all three can be achieved simultaneously. Over the years, I have heard many project managers tell customers and executives, "Pick two. You can have fast and cheap, fast and good, or good and cheap—but you can't have all three."
There is certainly some truth in that statement. However, one reason organizations invest heavily in project management is the belief that better planning, stronger coordination, improved communication, and disciplined execution can help them achieve all three more often than their competitors.
I was reminded of this while working with my former colleague, Dave Ewert, who founded and directed the Executive MBA program at Georgia State University. Dave spent many years taking students to Japan to study Japanese management and engineering practices. One of the organizations we visited was a large engineering firm.
During one trip to Tokyo, we stayed in Ginza, one of the city's most prestigious districts. From our hotel room, we could see an enormous construction project being managed by the firm. I counted more than thirty cranes operating simultaneously. At the time, it was one of the largest construction sites in Tokyo.
A few months later, several project managers from that same company visited the United States. We spent time introducing them to engineering and construction organizations throughout the Southeast.
One evening, while having dinner at the Columbia Restaurant in Ybor City, one of the Japanese project managers made a comment that stayed with me.
"I don't understand what is important or new about project management," he said. "Every project we do finishes on time and on budget."
At first, the statement surprised me.
A few days later, however, we met with the CEO and CFO of a large engineering and construction company in Atlanta, and I began to understand what he meant. They described a highly disciplined value-engineering process focused on reducing costs and shortening schedules on every project. They had developed their own enterprise project management system and required vendors and subcontractors to use it. Costs were tracked continuously. Resources were leveled regularly. Performance was measured weekly. Their goal was not simply to finish projects on time and within budget. Their goal was to finish projects faster, at lower cost, and with better outcomes than the previous project.
That conversation gets to the heart of why project managers study schedule logic, critical paths, fast-tracking, crashing, and schedule compression. The objective is not merely to create a schedule. The objective is to find ways to improve project performance.
Several years later, I found myself thinking about those conversations while watching the construction of the National Stadium in San José, Costa Rica. The stadium was built by a Chinese construction team and became the largest stadium in Central America. From the office of my attorney across the street, I watched the project progress at a pace that seemed remarkable by local standards.
Andrew Lainton, writing about China's ability to deliver large projects, observed:
"I have seen first hand on site all over Africa and Asia Chinese funded megaprojects under construction. They are very impressive. Undoubtedly they have made great strides on improving safety and reducing corruption which has held so many emerging economies back. Certainly it also helps that national, regional and local projects are ruthlessly aligned around a single vision. The key differences though are that they do things differently."
Whether one agrees with China's political system or not, the observation is relevant to project management. Large projects tend to move faster when goals are aligned, resources are available, obstacles are removed, and project teams are focused on a common objective.
The Tico Times made a similar observation after the National Stadium opened:
"The pace of construction of the new stadium was unparalleled by Costa Rican standards. While most large construction projects in Costa Rica take excessive time to construct or repair, such as the Caldera Highway which took 34 years to plan and create (and continues to undergo repairs), construction of the National Stadium was an impressive example of how quickly a major project can be assembled when the right crew is employed, government bureaucracy is pushed aside, and funding isn't an issue. Or maybe it is just a sign of what the Chinese are capable of doing."
As project managers, we may not control government policy, funding, labor markets, or culture. However, we do influence how work is organized, coordinated, sequenced, and executed.
That is why schedule logic matters.
Techniques such as critical path analysis, resource leveling, fast-tracking, crashing, and schedule compression exist because organizations are constantly asking the same question:
How can we deliver sooner without creating new problems along the way?
Sometimes the answer is that the schedule cannot be shortened without increasing cost or risk. Other times, careful planning and disciplined execution reveal opportunities that were not obvious at first.
The pursuit of better, faster, and cheaper is one of the reasons project management exists in the first place.

Illustration
Building Houses: Faster, Better, Cheaper
One of the goals of project management is to determine whether a project can be completed sooner without sacrificing performance or creating unacceptable costs and risks. Techniques such as fast-tracking, crashing, resource leveling, and critical path analysis exist because organizations are continually seeking better ways to shorten schedules.
Few examples illustrate this idea more dramatically than attempts to build houses in record time.
In 1945, a builders' association in Santa Rosa, California, attempted to construct a house as quickly as possible, both as a promotional event and as a study of building practices. Since then, organizations around the world have repeatedly attempted to break construction speed records, building houses, hotels, office buildings, bridges, and even skyscrapers in remarkably short periods.
One of the most famous examples is the documentary The 4 Hour House.
In 1983, the Building Industry Association of San Diego County organized a competition among construction trades with a seemingly impossible objective: build a complete house—from foundation to finish—in less than four hours while still complying with local building codes. To achieve that goal, two teams of approximately 350 workers had to rethink nearly every aspect of the construction process.
The challenge was not simply to work harder.
The challenge was to reorganize the work.
Activities that would normally be performed sequentially had to be performed simultaneously whenever possible. Materials had to be staged in advance. Resources had to be coordinated with extraordinary precision. Hand-offs between trades had to occur immediately. Every delay, bottleneck, and unnecessary movement had to be eliminated.
In project management terms, the teams were aggressively applying schedule compression techniques. They were fast-tracking activities, adding resources, removing waiting time, and continuously focusing on the work that controlled the project's duration.
The winning team completed the house in an astonishing 2 hours, 45 minutes.
Not surprisingly, quality issues were later reported by the home's eventual owners. However, quality concerns are not unique to record-setting construction projects. Similar complaints are heard in many production housing developments across North America. More importantly, the event demonstrated what can happen when project teams focus intensely on schedule compression.
The techniques used in that competition are not fundamentally different from those used today. Modern tools, equipment, prefabrication methods, and communication systems have improved, but the underlying project management principles remain largely the same.
Before watching The 4 Hour House, consider another example.
Habitat for Humanity

Habitat for Humanity has repeatedly demonstrated how effective planning, coordination, and resource management can dramatically reduce construction schedules. One of their key practices is eliminating inspection delays. Rather than waiting for inspectors to arrive at different points during construction, inspectors remain on-site and immediately identify issues that require correction.
By removing waiting time from the process, work can continue flowing without interruption.
In 2002, Habitat for Humanity completed a house in 3 hours, 26 minutes, and 34 seconds.
Both examples illustrate an important lesson from this Activity.
When project managers attempt to shorten a schedule, the solution is rarely to ask people to work faster. The real opportunity often lies in changing the sequence of work, reducing delays, increasing coordination, eliminating bottlenecks, and focusing attention on the activities that control the project's completion date.
That is the purpose of schedule compression—and one of the reasons understanding schedule logic and the critical path is so important.
Illustration
The Hidden Drivers of Project Duration: Why the Same Project Can Take Longer
I have restored six historic homes in Tampa, St. Petersburg, and a small city along Colorado's Front Range. One lesson I learned quickly is that the duration of a project is often influenced as much by its environment as by the work itself.
For example, permitting can significantly affect a remodeling or restoration project. In Colorado, I can usually walk into the permit office and obtain a permit for a fence, an exterior door replacement, or all-new plumbing for a house in just a few minutes. When I am ready for an inspection, I call the city; someone typically answers by the second ring, and an inspector is often scheduled for the next day.
My experience in Tampa has been very different.
There, the permitting and inspection process can become a project in its own right. Obtaining a permit may require multiple visits, phone calls, and follow-up actions. What takes minutes in one location can consume days or weeks in another. As I write this, I am still attempting to resolve a permitting issue on a Tampa property that began more than five years ago.
One of my restoration projects illustrates another important lesson about estimating duration.
The house was the original farmhouse in a large orange grove. The previous owners had completed a major remodel of the kitchen, several rooms, and one bathroom, but much of the house had not been touched since the days when the original owners held Friday night dances for the farm workers. Because I was primarily restoring existing features rather than making major structural changes, I did not need to involve the city extensively in the work.
Even so, the project ultimately took several years.
One example was a large live oak tree on the property. After decades of hurricanes and poor pruning by well-intentioned but inexperienced arborists, the tree required significant corrective work. The branches extended into the yards of neighbors on three sides, and removing too much growth at one time would have damaged the tree. The work had to be performed gradually over multiple seasons. Properly trimming that tree took nearly three years.
If someone had looked only at the activity name—"Trim Live Oak Tree"—they would have dramatically underestimated the duration. On that particular activity, there was no way to fast-track, crash, or compress the schedule. Mother Nature was in charge.

Access to materials can have a similar impact on project duration.
One of my restoration projects in Historic Ybor City was located thirty to forty minutes from most lumber yards, plumbing suppliers, electrical distributors, and hardware stores. Every forgotten fitting, missing tool, or unexpected problem required another trip across town. Time spent sitting in traffic may not be productive work, but it still affects the schedule.
During the COVID-19 pandemic, these challenges became even more apparent. Electrical supply shortages became so severe that it took nearly a week and visits to more than a dozen suppliers to locate the parts I needed.
Colorado presents a very different environment.
Most major suppliers are located within a mile or two of one another. Lowe's, Home Depot, Ace Hardware, Budget Home Supply, and several specialty suppliers can all be visited in less than an hour. In fact, I keep a personal scorecard for how quickly I can obtain materials or rent equipment. Less than a mile from one of my houses is the largest landscape materials supplier I have ever seen. I have hooked up my trailer, driven to the site, weighed my vehicle, loaded material, reweighed the trailer, paid for the load, and returned home in less than thirteen minutes.
As a result, the techniques I use to manage projects differ dramatically by location.
In Tampa and St. Petersburg, one of the most effective schedule-compression techniques is staging the project before work begins. Materials are ordered early, deliveries are coordinated, and supplies are stockpiled on-site whenever possible. What I cannot do is run to the store every time I need something. Trips must be planned, usually very early in the morning or late in the evening when traffic is lighter.
This example illustrates an important project management principle. The duration of an activity is not determined solely by the amount of work required. Permitting processes, inspections, supply chains, logistics, environmental conditions, stakeholder concerns, and local business practices all influence how long work will take.
In terms of schedule logic, these factors often become hidden constraints that influence the critical path and limit opportunities for schedule compression. Two projects may appear nearly identical on paper, yet have very different durations because they are performed in different environments.
When estimating durations, evaluating the critical path, or attempting to fast-track or crash a schedule, project managers must look beyond the work itself and consider the conditions surrounding it. A schedule may be mathematically correct and still be operationally unrealistic if those conditions are ignored.
I often thought about this when I lived in Manhattan. Looking at people working in the trades, I wondered how difficult it must be to get anything done. Every permit, material delivery, inspection, and movement of equipment seemed exponentially more difficult than in smaller communities.
Yet despite these differences, some organizations have learned how to complete remarkably different remodeling and rebuilding projects in nearly the same amount of time all across the country.
The following Project Example examines how they do it.
Illustration
Extreme Makeover: How They Build a House in One Week
In the previous illustration, we looked at the many factors that can affect the duration of a remodeling or construction project. Permitting requirements, inspections, supply chains, logistics, traffic, weather, labor availability, and local business practices can all influence how long it takes to complete the work.
Yet some organizations have learned to complete very different projects within remarkably consistent timeframes, regardless of location.
One of the most interesting examples was the television series Extreme Makeover: Home Edition, which aired on ABC from 2003 through 2012. The show became famous for rebuilding homes for deserving families in approximately one week. Each episode followed the same basic formula. While the family was sent away on vacation, hundreds of contractors, suppliers, volunteers, designers, and tradespeople worked around the clock to demolish an existing home and construct a new one before the family returned.
The projects took place all over the United States. Different cities. Different climates. Different building departments. Different contractors. Different site conditions.
Yet the duration was almost always the same.
One project took place near where I lived in Tampa.
On June 12, 2006, a small aircraft crashed into the Tate family home in the Davis Islands neighborhood, across a narrow channel from an island where I lived at the time. The Tate family owned a popular local pizzeria and had a large extended family, so many people in the area knew them by name.
Unfortunately, circumstances involving insurance coverage, the aircraft owner, and other legal issues made rebuilding the house difficult. The family found themselves in a situation where recovering from the loss of their home was far more complicated than anyone expected.
Extreme Makeover: Home Edition stepped in and built the family a new home.

What fascinated me was not simply the generosity of the effort. It was the project management.
The construction schedule looked something like this:
Monday, January 8: Existing house demolished.
Tuesday, January 9: New foundation slab poured.
Wednesday, January 10: Framing and roof completed.
Thursday, January 11: Plumbing, electrical, and drywall work completed.
Friday, January 12: Cabinets, tile, and garage door installed.
Saturday, January 13: Flooring, landscaping, and final touches completed.
Sunday, January 14: Tate family returns to a new home.
Viewed through the lens of traditional residential construction, the schedule appears almost impossible.
The reason it worked was not that people simply worked faster.
The project team controlled nearly every variable that normally delays construction. Materials were staged in advance. Specialized trades were scheduled to arrive exactly when needed. Inspections were coordinated. Hundreds of workers were available. Decisions were made immediately. Activities that would normally occur sequentially were carefully overlapped. In project management terms, the project was aggressively fast-tracked and crashed while maintaining intense coordination among all participants.
The result was a project duration that remained remarkably consistent despite being performed in different locations across the country.
This is one of the key lessons of schedule compression.
While project managers cannot eliminate every constraint, they can often reduce uncertainty by improving planning, coordination, communication, resource availability, and sequencing. The goal is not simply to make people work faster. The goal is to remove delays, eliminate bottlenecks, and create a predictable flow of work.
That is exactly what the Critical Path Method, fast-tracking, crashing, and schedule optimization techniques are designed to support.
Extreme Makeover: Home Edition may have been television entertainment, but it also served as a fascinating demonstration of what can happen when a project team focuses relentlessly on controlling the factors that normally extend project duration.

Figure 7.35 Before and after of the Tampa Extreme Makeover home.
Field Note
Faster? We Like It Just the Way It Is
One of the assumptions behind many project management techniques is that organizations want projects completed faster, better, and at lower cost. Techniques such as critical path analysis, fast-tracking, crashing, resource leveling, and schedule compression all exist because someone is looking for a way to improve project performance.

However, not everyone is interested in changing the status quo.
I was reminded of this while working with a group responsible for managing plant shutdowns for a Texas power company. Like many organizations in the utility industry, they spent much of the year planning for scheduled outages and maintenance shutdowns. These shutdowns were major projects involving hundreds of activities, multiple contractors, specialized equipment, and high costs.
The manager of the group was a friendly and rather large individual who had once played offensive line for a professional football team. One day, I was describing some of the things I had seen other customers accomplish using project management software. Several organizations had significantly reduced outage durations by improving schedule logic, identifying critical-path activities, coordinating resources more effectively, and applying schedule-compression techniques.
As I talked about shortening shutdown durations, he stood up, walked over to the office door, closed it, turned toward me, and lowered his voice.
"Please do not talk about faster around here."
Then he smiled and added:
"We like it just the way it is."
His comment was humorous, but it also highlighted an important project management reality.
The tools and techniques to improve project performance are often available. The challenge is not always technical. Sometimes it is organizational, cultural, or political.
A project manager may identify opportunities to shorten a schedule, reduce costs, or improve efficiency, but those changes can affect budgets, staffing levels, work practices, contractor relationships, incentives, and even job security. As a result, not every stakeholder views "faster, better, and cheaper" in the same way.
This does not mean schedule optimization is unimportant. Quite the opposite.
It means that before applying techniques such as fast-tracking, crashing, or critical path optimization, project managers should understand the organization's goals and the motivations of the people involved. Improving a schedule is often as much about managing people and expectations as it is about managing activities and dates.
One of the lessons I have learned over the years is that the ability to improve a project and the willingness to do so are not always the same thing.
Sometimes the biggest constraint in a schedule is not the critical path.
It is human nature.
Analyze The 4 Hour House Exercise
View the 4 Hour House video (10:44) below. The general specs on this house are:
Production home, but all cuts made onsite
Around 1500 square feet
Stick house built on a concrete slab
3 bedrooms 2 ½ bath
Built from the ground up
Includes landscaping - ready to move in
When you are done, complete the journal questions related to this exercise.
The 4 House House
Update Journal on the 4 Hour House and Determine Schedule Logic (30 minutes)
Journal
Make a note in your journal of things the planners and participants did on The 4 Hour House video that are not standard building practices related to:
In this video, what was done to compress the project's duration?
(For instance, they made this attempt with a single-story house built on a slab rather than a basement, which was stick construction vs. concrete block.)
What are some examples of fast-tracking you noticed in the video?
(For instance, they poured the slab, framed much of the house, and built the roof simultaneously.)
What are some examples of crashing?
(For instance, the event directors created a competitive environment; they built two houses side by side, with different teams building each house. The idea is that competition creates fun and is a strong performance motivator.) For example, the Petronas Twin Towers in Kuala Lumpur, Malaysia, were built by two competing construction companies. See the video of the Petronas Twin Towers construction.
Journal question:
"Reflect on the content you have covered and exercises you have done in this MS Project Master Class. So far, what have you learned will help you stay on schedule and perhaps complete projects faster without reducing scope or increasing cost?
Final Steps
Finalizing Activity 7 and Taking the Exam (1 hour, 3 minutes)
In this last section on Determine Schedule Logic:
Review Project Management and Microsoft Project Best Practices: Reflect on the fundamental principles of project management and the best practices associated with utilizing Microsoft Project as a project management tool.
Master Project Assessment: Ensure that your master project is up-to-date and a testament to your understanding of the intricacies involved in effective project initiation, planning, and execution.
File Review: Examine the list of files used throughout the application to consolidate your understanding of the tools and resources that have played a role in your project management journey.
Learning Objectives Evaluation: Reflect on the learning objectives set for this Activity, consider how well you've achieved each goal, and identify areas for further growth.
Activity Exam: Demonstrate your proficiency by tackling the Activity exam, which focuses on the key concepts and practical applications discussed in the MS Project Master Class Book and this Online Applications page.

Review Best Practices for Activity 7 (3 minutes)
Best practices in project management, including Microsoft Project, refer to a set of proven techniques, methods, or processes recognized as effective and efficient in achieving project objectives. These practices have evolved through the collective experiences of project managers and organizations across various industries. They are considered the most reliable and successful approach to managing projects and can be applied in different environments. When incorporating Microsoft Project into project management workflows, several specific best practices can further enhance project initiation, planning, execution, closing, and control.
Summary Elements
In general, except for entries in the Notes field or custom fields, don’t make any changes to summary elements or what Microsoft Project calls summary elements. Instead, allow summary elements to reflect what is indented below them rather than attempting to interact with indented summary elements, activities, and milestones. This best practice will make it easier to work with and interpret schedule changes.
Only link activities and milestones.
Do not apply timing constraints to summary elements.
Hard Logic Soft Logic
The critical path method begins with you reviewing a schedule and establishing links between activities and milestones.
In the first pass through the schedule, link elements based on hard logic; ask, “What must precede an activity or milestone?”
During the second pass, apply soft logic. You can’t do everything at once, so ask, “What do I prefer to do before something else?”
Auto Scheduled vs. Manually Scheduled
If you are using Manually Scheduled elements, you are missing the primary purpose of project management software. By the time you are determining schedule logic, all WBS elements should be automatically scheduled at this point in the planning process.
Calculation Engine
Learn all the rules governing the Calculation Engine and the resulting schedule behaviors. There is no shortcut or other way to master Microsoft Project.
Timing Constraints
Most activities, milestones, and summary elements should be ASAP or ALAP when executing a schedule. During execution, activity and milestone dates often become more fixed in time.
Because of the relationship between Timing Constraints and scheduling, selecting your Timing Constraints before linking activities and milestones is generally a best practice. A Timing Constraint can determine the types of links you make. .
External Links
Limit the number of external links you create. Numerous external links can be difficult to manage.
Avoid Circular Dependencies. Circular dependencies are defined as Dependency Loops. Dependency Loops are defined as Circular Dependencies.

Review Microsoft Project Features Used in Activity 7 (15 minutes)
Task Mode
Task Mode in Microsoft Project determines whether an element is scheduled manually or automatically by the calculation engine. Here are the key points about Task Mode:
WBS elements are manually scheduled by default, and only a few calculation engine rules apply. You can change that default in Project Options.
The Task Mode field displays an icon indicating whether an element is manually or automatically scheduled. You can toggle the mode by clicking this field, using the Task ribbon options, or using the Bridge Quick Access Toolbar.
You can select one of the modes to be the default for new elements.
You can set the default element mode for all new elements in a project via the Options dialog.
Figure 7.39 Task Mode selections.
Timing Constraints
Understanding the three types of constraints in Microsoft Project is crucial as it empowers you to effectively schedule elements by specifying conditions or restrictions on when an element can start or finish. These constraints are:
Flexible Constraints - These are your go-to when you want elements to be scheduled based on dependencies and project dates without any date restrictions. Examples include "As Soon As Possible" (the default) and "As Late As Possible". These constraints offer the advantage of maximum scheduling flexibility.
Semi-Flexible Constraints - These allow elements to be scheduled within a date boundary you set. Examples include "Start No Earlier Than" and "Finish No Later Than". These constraints provide some date boundaries while still allowing rescheduling within those dates.
Inflexible Constraints force an element to start or finish on a specific date, preventing automatic rescheduling. Examples include "Must Start On" and "Must Finish On." These constraints lock elements to particular dates and should be used sparingly.
Constraints are helpful when you need to account for external factors like resource availability, deadlines, milestones, or contract dates. It's recommended to use flexible constraints as much as possible to allow maximum scheduling flexibility based on dependencies.
Semi-flexible constraints can provide some date boundaries while still allowing rescheduling within those dates. Inflexible constraints should be minimized, as they lock elements to specific dates and prevent automatic rescheduling if delays occur. This can cause issues if dependencies or other factors change, as the locked elements will not adjust accordingly. You can set constraints in the Task Information dialog's Advanced tab by selecting the constraint type and entering a date if needed.
Elements with constraints other than flexible ones display an indicator symbol in the Indicators column, allowing you to quickly identify elements with date restrictions applied.
Timing constraints give you control over element scheduling. Still, inflexible ones should be used judiciously to allow Microsoft Project's calculation engine to adjust dates based on dependencies and project changes properly.
Figure 7.40 Timing Constraints selections.
Linking tasks in Microsoft Project is not just a feature, but a powerful tool that can significantly enhance your project management. Establishing dependencies between tasks ensures that specific tasks cannot start or finish until their predecessor tasks have reached a particular point. This feature is crucial in creating an accurate and realistic project schedule, as it effectively helps you manage your project's timeline.Types of Task Links
Finish-to-Start (FS): This is the most common type of link. It indicates that the dependent task cannot start until the predecessor task has finished.
Start-to-Start (SS): The dependent task cannot start until the predecessor task has started.
Finish-to-Finish (FF): The dependent task can only be finished once the predecessor task has finished.
Start-to-Finish (SF): The dependent task cannot finish until the predecessor task has started.
You can link tasks using various methods:
Select the predecessor task, hold the Ctrl key, and select the dependent task(s). Then, click the "Link Tasks" button on the Task ribbon or press Ctrl+F2.
In the Predecessors column, enter the task ID of the predecessor task for the dependent task.
Open Task Information in the Predecessors tab and enter links.
Split the window, apply as Task Form view, and
Manually drag and link tasks on the Gantt chart view.
Microsoft Project allows you to link tasks across different subprojects within a master project file. This is useful when tasks in one subproject depend on tasks in another subproject. To link tasks across subprojects, specify the subproject file name and task ID in the Predecessors column using "File_Name\Task_ID."Lag and Lead Time
When linking tasks, you can also specify lag or lead time, which adds a delay or overlap between the related tasks. Lag time delays the start or finish of the dependent task, while lead time allows the dependent task to start or finish earlier.
Linked tasks are visually represented on the Gantt chart with link lines connecting them. Additionally, the Predecessors column displays the task ID(s) of the predecessor task(s) for each dependent task. Proper task linking is essential for creating a realistic and achievable project schedule, as it accounts for task dependencies and ensures that resources are allocated appropriately based on the project's critical path.
Figure 7.41 Linking tasks in Microsoft Project.
Critical Path
The Critical Path Method (CPM) in Microsoft Project is used to identify and manage the sequence of elements critical to completing a project on time. Here's an overview of the Critical Path Method in Microsoft Project:
The critical path is the most extended sequence of linked elements determining the shortest possible project duration.
Elements on the critical path have zero total slack or float time, meaning any delay in these elements will directly impact the project's finish date. Total slack can be redefined in Project Options.
Microsoft Project highlights critical elements in red by default on the Gantt chart timeline when the "Show Critical Path" option is enabled.
Importance of the Critical Path
The critical path represents the elements that must be completed on schedule to prevent delays in the overall project.
If you need to shorten the project's duration, initially focus on the critical path.
By focusing on the critical path, project managers can prioritize resources, closely monitor progress, and take proactive measures to avoid delays.
Any delay in a crucial element will cause a corresponding delay in the project's completion date, making it essential to manage these elements effectively.
Managing the Critical Path
Regularly review and monitor the critical path, as it can change as elements progress or new delays occur.
Allocate appropriate resources and prioritize critical elements to ensure they stay on track.
If a critical element is delayed, explore options to mitigate the impact, such as reallocating resources, working overtime, or adjusting element dependencies.
If feasible, consider using techniques like fast-tracking (overlapping elements) or crashing (adding resources) to shorten the duration of critical elements.
By effectively utilizing the Critical Path Method in Microsoft Project, project managers can gain valuable insights into the elements that directly impact the project's timeline. This knowledge enables them to make informed decisions, allocate resources strategically, and take proactive measures to ensure successful project delivery within the planned timeframe.
Figure 7.42 Critical path in Microsoft Project.
What is Critical in Microsoft Project
A WBS element (A) is marked as critical if its Total Slack is zero (i.e., it meets the Total Slack criteria in Project Options). However, other scheduling conditions can mark an element as critical or result in a Total Slack of zero.
B - A Must Start On or Must Finish On timing constraint.
C - An As Late As Possible timing constraint in a project scheduled from the start date in Project Information.
D - A WBS element with a Deadline date at or past the date.
E - A timing constraint that is at or past the date.
Figure 7.43 What is marked as critical in Microsoft Project.

Ensure Your Master Project and Exercise Activity 7 Files are Up-To-Date (15 minutes)
When finished with exercises 1 - 8, you should have the following completed on your Master Project and several exercise files.
Your Master Project should have the following:
The correct Task Mode and Timing constraints selections. The Timing Constraints for summary elements should be ASAP. In Exercise 3, the instructions were to ensure that all elements in your Master Project are Automatically Scheduled and that you have applied the correct Timing Constraints to activities, milestones, and summary elements.
After completing Exercise 6, your Master Project should have preliminary scope, time, work, and cost estimates. The WBS is the scope estimate. If all those elements are completed, the product, service, or result will be delivered along with the project objectives. You can review the work, cost, and schedule on the project summary level.
All of your activities and milestones. Except for the Project Started and Project Finished elements, all activities and milestones should have at least one predecessor and one successor.
There is no redundancy in your linking.
Summary elements have no links.
Note: It is tempting to consider the project estimating phase nearly complete at this point; however, we still have several more factors to consider and plan for, such as risk and resource availability.
After completing the second part of Exercise 8, you created a new network diagram view in your Master Project. This view should contain the Example—Critical Path template shown in the following figure.
Figure 7.44 Exercise results, imported Template into a Network Diagram view.
Last, in your Master Project, when finished with the third part of Exercise 8:
The Gantt Chart view of your Master Project, you should have:
The Bridge Critical Path table is applied.
The background of the Critical Tasks, the Text Styles item, formatted.
Critical Tasks and Slack are displayed in Bar Styles, as shown in the figure below.
Figure 7.45 Exercise Results, Critical Formatted in the table and view. Slack formatted in the taskbars side of the window pane.
Exercise 1:
The Travel.mpp should look similar to the one in the following figure. The Flight Departs Must Start On date should be 7/4/21 at 3:20 PM; the green note in the Gantt Chart should also show that. The A New Task should have an SNET constraint of 7/4/21.
Figure 7.46 Exercise 1 results for Travel.mpp.
Exercise 2:
The file Task Mode 2.mpp should have the same durations as in the figure below. The first four tasks are manually scheduled, and the next six are auto scheduled. The durations for Summary 2 and the indented tasks should also be the same as in the figure below.
Figure 2.47 Exercise 2 results for Task Mode 2.mpp
Exercise 4:
The Scheduling Engine.mpp file should look similar to the one in the figure below.
The duration of the project should be around 4.5 months.
The two tasks other than standard dependencies should be highlighted in green.
#7 should be ASAP.
#6 should have the Instructional Designer assigned.
#12 should have notes in bold red.
All tasks should have some slack.
Figure 2.48 Exercise 4 results for Scheduling Engine.mpp
Exercise 5:
The Types of Links.mpp file should have the same links as those in the figure below.
Figure 2.49 Exercise 5 results for Types of Links.mpp
Exercise 7:
After this review, you should have a good understanding of CPM calculations. Microsoft Project has fields for all of these calculations:
Early Start (Separate, but same calculation for Start)
Early Finish (Separate, but same calculation for Finish)
Last Start
Late Finish
Total Slack
Free Slack
Project Duration (Duration field on the Project Summary Level)
You should have figured out what was causing the miscalculation on the project summary level for the Boulder to Tampa.mpp file. The duration should be 4.42 days as shown in the figure below.
Figure 2.50 Exercise 7 results for Boulder to Tampa.mpp
Exercise 8 (First Part):
At this point, with the CPM1.mpp file, your nodes should have the same fields as those in the figure below. Don’t worry if there are other differences.
Figure 7.51 Customized nodes in a network diagram.


If you are working with a coach or plan to earn a certificate, use this file folder system to store your files.
Review List of All Completed Activity 7 Files (5 minutes)
The files used for these Master Class Online Applications are:
Your Master Project.mpp. See previous section.
Travel.mpp.
Task Mode 2.mpp,
Scheduling Engine.mpp.
Types of Links.mpp.
Boulder to Tampa.mpp.
CPM1.mpp.
Your updated Journal.
Completed evaluation of the learning objectives in Learning Objectives for Determine Schedule Logic.xlsx in the next section.
PDF of your exam results.

What to Do with Your Files
After you finish this Activity, remember to save your files and keep them organized.
If you are working with a Master Class Coach:
Put all the files listed above into your folder structure as suggested.
Zip these folders before your next session.
Email the zipped file to your Master Class Coach.
You don’t need to send your files to a Certified Master Class Reviewer to earn a certificate; your coach will review your work.
If you are NOT working with a Master Class Coach (Certificate Path):
Put all the files listed above into your folder structure.
Zip the files to archive them and keep everything organized.
When you’re ready, send all your Activity files together to a Certified Master Class Reviewer for evaluation.
Important
As you work through all Activities, you’re building a complete set of project files. Keep everything organized since you’ll need the full set for review.
Evaluate Activity 7 Learning Objectives (10 minutes)
To assess whether you have met the learning objectives outlined for the MS Project Master Class Book, you could review the following questions:
Significance of Deadlines and Constraints
Can I explain the significance of setting deadlines in Microsoft Project and how they influence project scheduling?
How do different types of timing constraints affect the scheduling of tasks and milestones?
Sequencing Activities and Milestones
Can I establish and modify dependencies between activities and milestones in a Microsoft Project plan?
Can I determine when to use each of the four types of dependency relationships and how to apply lead or lag time appropriately?
Analyzing and Utilizing Dependency Relationships
How do I identify and assess the impact of predecessor and successor relationships in my project schedule?
Reviewing the Project Timeline and Critical Path
How can I review and interpret the project timeline and critical path?
Can I identify tasks with zero total or free slack and understand why they are critical to the project’s timeline?
Managing the Critical Path
What strategies can I implement to manage critical path tasks effectively to ensure they meet their deadlines?
Understanding the Project Scheduling Framework
How do I apply a comprehensive scheduling framework in Microsoft Project to an actual project?
Enhanced Project Scheduling Abilities
How have I improved my ability to navigate the complexities of project scheduling to keep projects on track?
These questions cover a range of cognitive levels, from understanding and application to analysis and synthesis, ensuring a comprehensive assessment of the learning objectives.

Before taking the following exam, click the Download icon above to open the Learning Objectives for Determine Schedule Logic.xlsx and complete this evaluation of the learning objectives.


Final Score
When you are finished, print your score and exam results as a PDF file if you are working with a Coach or plan to earn a certificate.
Take the Activity 7 Exam (15 minutes)
Complete this Activity by taking the exam. Take the exam by clicking on the Exams button below.
Here are some essential guidelines for taking the exam:
Approach the exam as a closed-book assessment, relying solely on your memory and grasp of the subject matter.
Always select the most appropriate answer.
Keep in mind that answers carry different weights.
Feel free to attempt the exam multiple times to refine your understanding.
To attain the MS Project 24 Hour Master Class Certificate of Completion, achieve a final score of 80% or higher.

Return to the Master Class Book, complete the Activity 7 Summary section, and then continue to Activity 8: Plan Communications
Determine Schedule Logic FAQs
What is schedule logic in Microsoft Project?
Schedule logic consists of the relationships, constraints, deadlines, calendars, and rules that determine when WBS elements start and finish. It helps Microsoft Project determine project duration, identify the critical path, and update the schedule as things change.
What is the difference between Manually Scheduled and Automatically Scheduled tasks?
With Manually Scheduled WBS elements, the project manager sets the dates directly. Automatically Scheduled WBS elements let Microsoft Project set dates based on dependencies, calendars, constraints, and resources. Most professional schedules use Automatically Scheduled elements because they adjust as the project changes.
What is the best Task Mode to use in Microsoft Project?
For most projects, Automatically Scheduled elements work best because Microsoft Project can update dates when things like dependencies, durations, resources, or constraints change. Manually Scheduled elements are usually helpful early on, when you don’t have all the details yet.
What is the difference between a deadline and a timing constraint?
A deadline is a target date that Microsoft Project watches but does not force. A timing constraint, like Must Finish On (MFO) or Must Start On (MSO), actually controls when an element can start or finish. Deadlines give you flexibility, but constraints limit it, so use them carefully.
When should timing constraints be used in Microsoft Project?
Only use timing constraints other than the default ASAP constraint when there is a real business, contract, rule, or physical need. Using too many constraints can make your schedule less flexible, create confusing critical paths, and make schedules harder to manage. Remember, some of these constraints are categorized as fixed or semi-flexible.
Should I define timing constraints before linking tasks?
Yes. It’s best to determine timing constraints before linking activities and milestones. Constraints can affect what kinds of dependencies you set between activities and milestones.
What are the four types of dependencies in Microsoft Project?
Microsoft Project uses four types of dependencies:
Finish-to-Start (FS)
Start-to-Start (SS)
Finish-to-Finish (FF)
Start-to-Finish (SF)
Finish-to-Start is the most common relationship and is usually the default type. Start-to-Finish is rarely used.
What are lead time and lag time in Microsoft Project?
Lead time allows a subsequent element to start before the previous one is finished. Lag time adds a delay between activities. Both help you model real-world schedules more accurately.
What is the Critical Path Method (CPM)?
The Critical Path Method (CPM) is a way to find the longest chain of dependent activities and milestones that sets the earliest finish date for a project. CPM also calculates float (slack), so project managers know which elements can be delayed without affecting the project’s end date.
Why is the longest path called the critical path?
The longest path sets the earliest date the project can finish. If any element on this path is delayed, the whole project will finish later unless you take action to fix it.
What is float or slack in Microsoft Project?
Float, or Total Slack, in Microsoft Project is the amount of time a WBS element can be delayed without pushing back the project’s finish date. Tasks on the critical path usually have zero Total Slack.
What is free float in Microsoft Project?
Free Float (Free Slack) is the amount of time an element can be delayed without delaying the early start of any immediate successor. Free Float is always less than or equal to Total Slack.
What is negative slack?
Negative Slack indicates that a WBS element is scheduled later than a required date, such as a deadline, timing constraint, or project end date. For example, -5 days of Total Slack means an activity must be shortened by five working days to meet the required finish date.
Why does Microsoft Project mark WBS elements as Critical when they are not on the critical path?
Microsoft Project's definition of Critical includes more than just elements on the critical path. WBS elements may also be marked Critical because they have deadlines, fixed or semi-flexible timing constraints, ALAP scheduling, or negative slack. This is one reason project managers should distinguish between the Critical Path and Microsoft's broader definition of Critical.
How do I identify the critical path in Microsoft Project?
The critical path can be displayed using Gantt Chart formatting, filtering, custom views, or the Network Diagram view. Microsoft Project automatically recalculates the critical path as changes are made to the schedule.
What is the purpose of a Network Diagram in Microsoft Project?
A Network Diagram visually displays task dependencies and schedule logic. It helps project managers understand workflow, identify critical paths, and communicate how activities and milestones relate to one another.
What is fast-tracking in project management?
Fast-tracking shortens project duration by overlapping activities that would normally occur sequentially. It can reduce schedule duration but often increases coordination requirements and project risk.
What is crashing in project management?
Crashing shortens project duration by adding resources, spending additional money, or changing how work is performed. Crashing is often evaluated by comparing the cost of acceleration against the value of finishing sooner.
How do experienced project managers shorten project schedules?
Experienced project managers typically begin by analyzing the critical path, reviewing dependencies, eliminating unnecessary delays, reducing constraints, improving resource utilization, and evaluating opportunities for fast-tracking and crashing before asking people to simply work faster and harder.
Suggestions and Corrections
Please help us make this MS Project Master Class Book and the Master Class Online Applications better. Click on the Comments button below to send us suggestions and corrections.